


Next: Reliability
Up: report
Previous: Simulations
From the simulation data presented in the last section we can now
extract approximate expressions for the functions  and
and  of Eqs. 3-4. To carry out the
fit for , the Monte Carlo data for
of Eqs. 3-4. To carry out the
fit for , the Monte Carlo data for  were histogrammed
in bins of 200MeV
were histogrammed
in bins of 200MeV 
 . For each energy bin there is an
independent histogram of vs
. For each energy bin there is an
independent histogram of vs  , as shown in Fig. 1.
Each of these was then submitted to fit to a 4-parameter formula
consisting of a monopole plus a linear term, as follows.
, as shown in Fig. 1.
Each of these was then submitted to fit to a 4-parameter formula
consisting of a monopole plus a linear term, as follows.
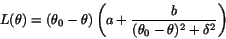 |
(6) |
where  is measured in photoelectrons and the angles ,
 and
and  are in degrees. The value of is
the zero of the function, supposed to be the polar angle of the
detector edge, and describes the width of the falling
gain curve at the acceptance edge.
are in degrees. The value of is
the zero of the function, supposed to be the polar angle of the
detector edge, and describes the width of the falling
gain curve at the acceptance edge.
Values for each of the parameters ,  ,
,  , and
were obtained for the 9 energy bins shown in
Figs. 1-2, and these in turn were fitted
vs energy. The results are given in Eq. 7
, and
were obtained for the 9 energy bins shown in
Figs. 1-2, and these in turn were fitted
vs energy. The results are given in Eq. 7
The curves in Fig. 1 are the results of the above
parameterization. Overall it gives a good description of the data.
The points below  have been excluded from the fit because these
showers start inside the beam hole. The points above
have been excluded from the fit because these
showers start inside the beam hole. The points above  have
also been excluded, which is about where one might guess from these
data that the LGD acceptance ends. The biggest departure of the
curve from the data occurs for the two highest energies in
Fig. 1, where the data show a sharper maximum near
have
also been excluded, which is about where one might guess from these
data that the LGD acceptance ends. The biggest departure of the
curve from the data occurs for the two highest energies in
Fig. 1, where the data show a sharper maximum near
 than the curves do. One might invoke another parameter to
patch up that region, but I consider the discrepancy to be
negligible, especially in view of the small angular region and
the fact that it is at larger angles where the photon spectrum
is mostly soft.
than the curves do. One might invoke another parameter to
patch up that region, but I consider the discrepancy to be
negligible, especially in view of the small angular region and
the fact that it is at larger angles where the photon spectrum
is mostly soft.
The function was obtained by a similar procedure.
The simulation data for shower mean  were histogrammed on a
grid of 200MeV bins. The slices in constant
were histogrammed on a
grid of 200MeV bins. The slices in constant  were fitted to a function of and then the parameters
were fitted as a function of , as follows.
were fitted to a function of and then the parameters
were fitted as a function of , as follows.
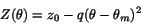 |
(8) |
where  is given by Eq. 5 and the other two parameters
are described by the linear functions given in Eq. 9.
is given by Eq. 5 and the other two parameters
are described by the linear functions given in Eq. 9.
 is measured in cm.
This parameterization is shown by the curves in Fig. 2.
Next: Reliability
Up: report
Previous: Simulations
Richard T. Jones
2003-02-12