Jie's Results
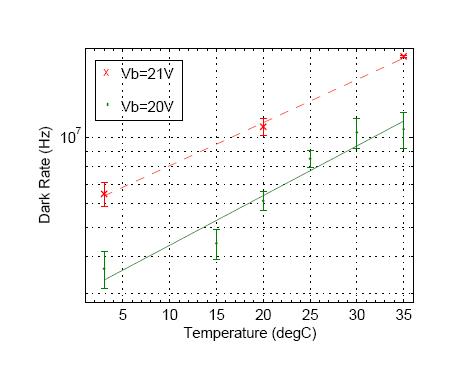
The experiment was done with two different bias voltages; 21V and 20 Volts. The tempertaure readings were taken at 3 degrees, 20 degrees and 35 degrees Celsius. This was the range at which the temperature controller could operate. Since there was much more error when the bias voltage was at 20V, more trials were done at that bias voltage to better fill in the relationship between temperature and dark rate. These trials were conducted at the temperatures of 15, 25, and 30 degrees Celsius. Each trial uses data from at least from at least 50,000 events taken in at least 14 hours. The error bars from that emanate from the center represent 1 standard deviation away from the center. This would encompass 66.8% of all the data that was taken in each trial. Since there were less events when the bias voltage was at 20V, the error bars were much larger. Since there was less of a signal to detect, the small amount of electrical noise would make up a larger percentage of the data, causing a lot more error in the data.
