Event distributions of analog signals from different BSD
counters are similar
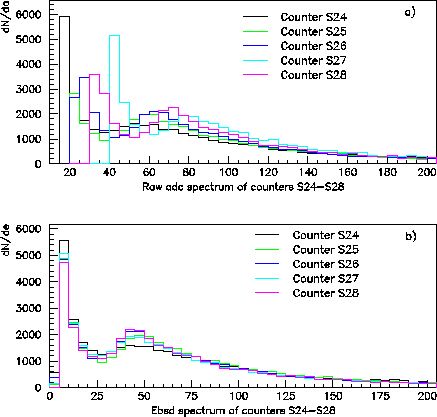
in shape, but due to different counter characteristics, such as threshold,
light collection efficiency etc.,
the position and height of the maximum of the distribution
varies from counter to counter (see Fig. 1a). However,
all BSD counters should have tails of adc spectra (aBSD
![]() 200) that are similar both in shape and magnitude. Thus, instead
of matching maxima or mean values of adc distributions,
it is preferable to match the tails of distributions
by matching integrated adc spectra to some chosen
reference counter within each layer.
This method makes the matching insensitive to distortions of the spectra
at low pulse height that come from discriminator thresholds.
200) that are similar both in shape and magnitude. Thus, instead
of matching maxima or mean values of adc distributions,
it is preferable to match the tails of distributions
by matching integrated adc spectra to some chosen
reference counter within each layer.
This method makes the matching insensitive to distortions of the spectra
at low pulse height that come from discriminator thresholds.
The first step in setting relative gains is to choose some point
![]() above threshold in the adc distribution of the reference channel and
calculate the integral from this point to infinity.
The second step is to find the appropriate value of e
from each other counter so that the corresponding integrals are
equal to the reference one
above threshold in the adc distribution of the reference channel and
calculate the integral from this point to infinity.
The second step is to find the appropriate value of e
from each other counter so that the corresponding integrals are
equal to the reference one
We decided to calculate g for two different integration limits
![]() and to take the average value of g.
Counter R03 is chosen to be the reference one for all other counters.
In Table 1 are given gain constants obtained for
two chosen reference values
and to take the average value of g.
Counter R03 is chosen to be the reference one for all other counters.
In Table 1 are given gain constants obtained for
two chosen reference values ![]() = 80, and
= 80, and ![]() = 120.
Multiplying adc signal by the corresponding g one can set
gains in different BSD counters relative to the chosen one.
In Fig. 1b one can see adc spectra from several straight
counters after their relative gain has been applied.
= 120.
Multiplying adc signal by the corresponding g one can set
gains in different BSD counters relative to the chosen one.
In Fig. 1b one can see adc spectra from several straight
counters after their relative gain has been applied.
| Counter |
|
|
g | ||||||
| R00 | 0.8081 | 0.8219 | 0.8150 | 0.0138 | |||||
| R01 | 0.6897 | 0.7018 | 0.6957 | 0.0121 | |||||
| R02 | 0.6504 | 0.6704 | 0.6604 | 0.0200 | |||||
| R03 | 1.0000 | 1.0000 | 1.0000 | 0.0000 | |||||
| R04 | 0.5369 | 0.5333 | 0.5351 | 0.0036 | |||||
| R05 | 0.9091 | 0.9375 | 0.9233 | 0.0284 | |||||
| R06 | 0.9091 | 0.9231 | 0.9161 | 0.0140 | |||||
| R07 | 0.9756 | 0.9917 | 0.9837 | 0.0161 | |||||
| R08 | 1.0667 | 1.0909 | 1.0788 | 0.0242 | |||||
| R09 | 0.7143 | 0.7229 | 0.7186 | 0.0086 | |||||
| R10 | 0.7018 | 0.6977 | 0.6997 | 0.0041 | |||||
| R11 | 0.8696 | 0.9023 | 0.8859 | 0.0327 | |||||
| L12 | 1.3333 | 1.3483 | 1.3408 | 0.0150 | |||||
| L13 | 1.1765 | 1.2000 | 1.1882 | 0.0235 | |||||
| L14 | 1.1594 | 1.1538 | 1.1566 | 0.0056 | |||||
| L15 | 1.2500 | 1.2903 | 1.2702 | 0.0403 | |||||
| L16 | 0.8989 | 0.8824 | 0.8906 | 0.0165 | |||||
| L17 | 1.0526 | 1.0435 | 1.0481 | 0.0092 | |||||
| L18 | 1.0811 | 1.0909 | 1.0860 | 0.0098 | |||||
| L19 | 1.3115 | 1.3333 | 1.3224 | 0.0219 | |||||
| L20 | 0.9639 | 0.9756 | 0.9697 | 0.0118 | |||||
| L21 | 1.1111 | 1.1215 | 1.1163 | 0.0104 | |||||
| L22 | 0.8247 | 0.8163 | 0.8205 | 0.0084 | |||||
| L23 | 0.9877 | 0.9524 | 0.9700 | 0.0353 | |||||
| S24 | 0.9302 | 0.9023 | 0.9162 | 0.0280 | |||||
| S25 | 1.0127 | 1.0526 | 1.0326 | 0.0400 | |||||
| S26 | 1.0959 | 1.1321 | 1.1140 | 0.0362 | |||||
| S27 | 1.1111 | 1.1429 | 1.1270 | 0.0317 | |||||
| S28 | 1.1594 | 1.1881 | 1.1738 | 0.0287 | |||||
| S29 | 1.1765 | 1.1765 | 1.1765 | 0.0000 | |||||
| S30 | 0.7921 | 0.7643 | 0.7782 | 0.0277 | |||||
| S31 | 0.7339 | 0.7547 | 0.7443 | 0.0208 | |||||
| S32 | 1.2903 | 1.2903 | 1.2903 | 0.0000 | |||||
| S33 | 0.8247 | 0.8571 | 0.8409 | 0.0324 | |||||
| S34 | 0.8989 | 0.9231 | 0.9110 | 0.0242 | |||||
| S35 | 0.8889 | 0.9023 | 0.8956 | 0.0134 | |||||
| S36 | 0.8989 | 0.9160 | 0.9075 | 0.0172 | |||||
| S37 | 1.0811 | 1.0811 | 1.0811 | 0.0000 | |||||
| S38 | 0.8602 | 0.8759 | 0.8681 | 0.0157 | |||||
| S39 | 1.0390 | 1.0345 | 1.0367 | 0.0045 | |||||
| S40 | 1.0127 | 1.0256 | 1.0191 | 0.0130 | |||||
| S41 | 0.8247 | 0.7843 | 0.8045 | 0.0404 | |||||
| S42 | 1.0127 | 0.9836 | 0.9981 | 0.0291 | |||||
| S43 | 1.2698 | 1.2903 | 1.2801 | 0.0205 | |||||
| S44 | 1.0526 | 1.0619 | 1.0573 | 0.0093 | |||||
| S45 | 0.8791 | 0.8571 | 0.8681 | 0.0220 | |||||
| S46 | 1.0667 | 1.0811 | 1.0739 | 0.0144 | |||||
| S47 | 1.1111 | 1.1215 | 1.1163 | 0.0104 |
 |