To map out the dependence on beam intensity of the yield of true-tagged events, use is made of a model of the Radphi trigger that is described in detail elsewhere Ref. [2]. Without further comment I reproduce here Table 1 from that note, with values of the parameters updated based upon the measurements taken in 1999. The fact that several of the background suppression factors in Table 3 are much smaller than initially supposed explains why the rate of events to tape is so much smaller than predicted.
| parameter | value | method | |||||
|
|
/s/nA | fit to TDC data | |||||
|
|
/s/nA | fit to TDC data | |||||
| /s/nA | fit to TDC data | ||||||
| /s/nA | fit to TDC data | ||||||
|
|
s | TDC spectra | |||||
|
|
s | (disabled) | |||||
|
|
s | fit to scaler data | |||||
|
|
s | fit to scaler data | |||||
|
|
s | measured on scope | |||||
|
|
s | measured on scope | |||||
|
|
measured at low rates | ||||||
|
|
from TDC spectra | ||||||
|
|
measured at low rates | ||||||
|
|
from TDC spectra | ||||||
|
|
from TDC spectra | ||||||
|
|
from TDC spectra | ||||||
|
|
from TDC spectra | ||||||
|
|
from TDC spectra | ||||||
|
|
from TDC spectra | ||||||
|
|
from TDC spectra | ||||||
|
|
from TDC spectra | ||||||
|
|
from TDC spectra | ||||||
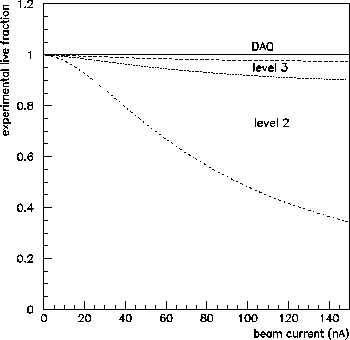
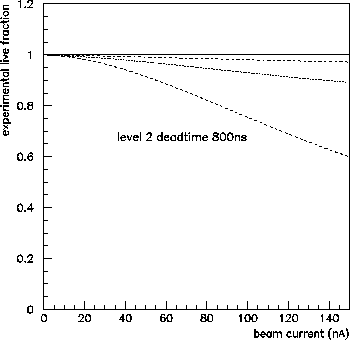
The model gives good agreement with the measured rates at 125nA and 20nA taken during July-August 1999. Using the model it is now possible to extrapolate to beam currents where there are no measurements, and decide what is the optimum beam current at which to run. The experimental live-time fraction is shown in Fig. 4 under the conditions of 1999 running. The dead-time contributions from each of DAQ, level 3 and level 2 are shown by the stacked curves. Level 2 is clearly the most important. As mentioned above, we have a scheme in hand that will enable us to reduce the level 2 dead-time per event by a factor of 2. The new live-time curve from this modification resulting resulting from this modification is shown in Fig. 5.
 |
 |
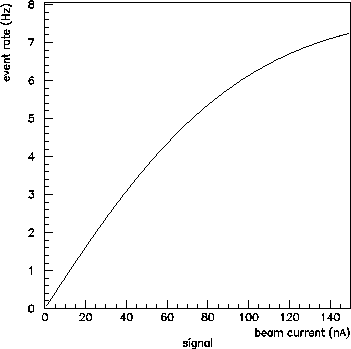
The bottom line is determined by the number of true-coincidence
events being written to tape per second. This quantity is
plotted vs beam current if Fig. 6. The point
represented by ![]() photons/s is 125nA in this figure.
The curve is still rising at this current, indicating that the
trigger is still some distance from saturation.
photons/s is 125nA in this figure.
The curve is still rising at this current, indicating that the
trigger is still some distance from saturation.
From these results we conclude that the Radphi trigger is now capable of taking data at the luminosity listed in the proposal. Some improvements over the performance obtained in 1999 can yet be obtained by streamlining the level 2 trigger and optimizing the relative timing of the tagger and BSD counters. A further study is planned to investigate how much acceptance can be gained by reducing the diameter of the target. Using the data on tape from the 1999 run it will be possible to refine the choice of the BSD threshold to maintain good acceptance for protons while improving somewhat the background rejection at level 1.
 |