Difference between revisions of "Analysis of Diamond Cantilever Vibration"
| (One intermediate revision by the same user not shown) | |||
| Line 70: | Line 70: | ||
==Results== | ==Results== | ||
| + | |||
| + | The calculated values for $k$ show a positive, highly linear pattern. This results in the series of harmonic frequencies growing at an exponential rate. This created difficulties during the experimental phase; rapidly increasing frequencies caused a proportional drop in power/amplitude and made harmonics above three undetectable with our equipment. Increasing the amplification caused by the optical lever system to the degree needed to "see" those modes resulted in too great an uncertainty to be useful. | ||
| + | |||
[[File:Data_Record.pdf]] | [[File:Data_Record.pdf]] | ||
[[File:FirstFour.jpg]] | [[File:FirstFour.jpg]] | ||
| − | [[File:NonFirstFour.jpg] | + | [[File:NonFirstFour.jpg] |
| + | |||
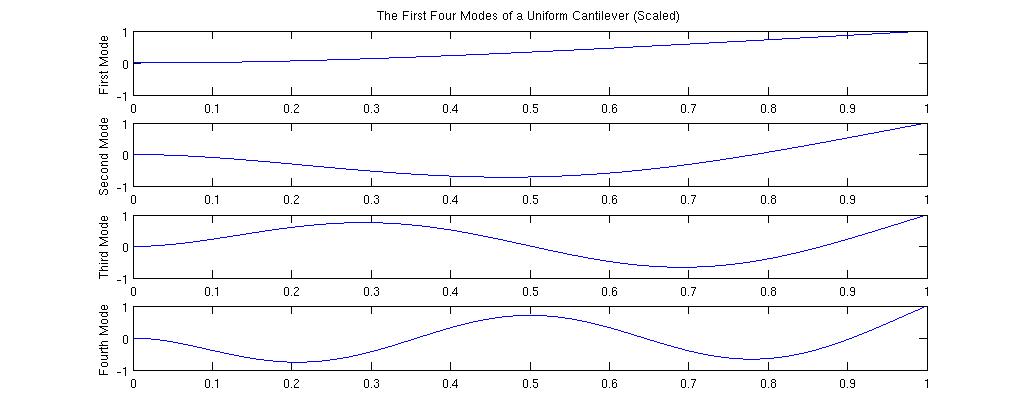
| + | Each eigenmode has one more node than the previous, starting with no nodes at all on the fundamental frequency. These were clearly visible on the lower harmonics. Because the absolute value of amplitude depends on power, these model-predicted functions need to be scaled to the experimental data and considered in terms of relative amplitude. The eigenmodes for cantilevers of nonuniform shape are similar to the uniform ones in overall shape and number of nodes, but show idiosyncrasies of increasing severity in correspondence with sharp changes in width. For example, a square wafer like the one to be used in the GlueX experiment shows a shift in the location of its nodes towards the slimmer ends of the cantilever, while a more slender shape shows much less of a shift. | ||
| + | |||
| + | ==Conclusions== | ||
| + | Work on this project, like the overall GlueX project, is still ongoing. Current endeavers include comparing the experimental data to the results predicted by the models, in order to quantify any discrepancy there and determine possible improvements. Other considerations include improving the optical lever system, which reported data with too high an uncertainty value to consistently measure more than three modes above the fundamental frequency. The high uncertainty was mostly caused by scatter in the laser; this could be improved with the use of a laser with a higher Q factor or by decreasing the frequency of imperfections on the surface of the cantilevers. | ||
Latest revision as of 23:55, 3 March 2013
Purpose
In order to facilitate coherent bremsstrahlung radiation, the movement of the diamond radiator due to natural oscillation must be minimized. One possible way to mount the diamond involves supporting it from a single corner and leaving the other end free. The purpose of this work is to theoretically model the free vibrations of such a system to determine if it is a realistic solution to the problem of mounting the diamond.
Predictions
The diamond, when mounted from one corner, can be approximately modeled as a cantilever (a beam fixed at one end and free at the other) with non-uniform width. In order to determine the natural oscillatory motion of the diamond, I decided to develop a mathematical model for the motion of cantilevers with non-uniform width, and test that model with data from physical cantilevers.
Model
The cantilever system is best modeled by first considering the simplest version, a beam of uniform width, thickness, and height, fixed at one end and free at the other. It's possible to derive a fourth-order differential equation to describe the motion of a beam system by comparing the shear and torque on each height-wise section of the beam.
By assuming constant thickness, we can simplify this equation to something much more manageable.
Knowing that the motion of the beam will be oscillatory let's assume that the solution can be divided into two parts, one representing the maximum amplitude of the motion and the other representing the periodic nature of the motion.
We can now search for as an eigenfunction.
To see the process by which y_a is found, refer to the document embedded below.
Uniform-Width Analytical Model
To find the solution to the nonuniform case, we first express the solution as a linear combination of the solutions to the uniform case.
We know that the solutions to the uniform case, as the eigenfunctions of a Hermitian matrix operation, are orthogonal. This means that taking the inner product of any one of these solutions with any other solution is the equivalent of the kronecker delta .
To see the process by which the coefficients corresponding to the uniform case solutions are found, refer to the document embedded below.
Nonuniform-Width Analytical Model
Experiment
Materials
Fifteen test cantilevers of varying shapes cut from .032 inch thick sheet aluminum were used as experimental units to compare to the predicted results. (Cantilever construction was performed by Brendan Pratt in the UConn metal-working shop.)
- Nine cantilevers of uniform width (rectangular shape)
- Six cantilevers of non-uniform width linearly dependent on the length (diamond shape)
Methods
- Step 1: Location of Resonance Frequencies
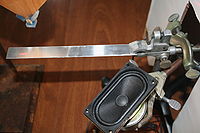
Analysis was run in order to find the exact locations of the resonance frequencies for each individual cantilever. The cantilevers were mounted horizontally one at a time using a clamp to hold them fixed from one end. A microphone was set up near the tip of the cantilever, at an approximate distance of three centimeters away. The cantilever was then given a short, non-periodic impulse (a flick near the end) and allowed to settle into its natural oscillatory frequencies undisturbed. The microphone picked up the compressed air waves made by the cantilever’s vibration. This process was repeated three times for each cantilever. From this data the resonance frequencies were extracted using Fourier analysis.
- Step 2: Measuring Relative Amplitude:
The optical lever technique was used to determine the relative amplitude of cantilever vibration at different points along the length. Each cantilever was mounted in the same fashion as before, and the clamp was attached to a ring stand. Also attached to the ring stand was another clamp holding a small speaker. Resonance was achieved by using the speaker to produce a constant sinusoidal output, which traveled through the ring stand to excite the cantilever. A class 111a laser pointer was mounted opposite the free end of the cantilever, pointing towards the fixed end. A white projection screen was mounted above the fixed end of the cantilever. In order to amplify the motion of the cantilever, which is normally very slight, the laser is reflected off the cantilever’s surface, and its own angle of motion is augmented by that of the cantilever relative to the horizontal at the point of reflection.
To further increase this amplification, a system of mirrors was designed so that the laser would reflect off the cantilever multiple times over the same small lengthwise distance, multiplying the measured change in amplitude by the number of “bounces.” After coming out from the mirror system the laser projects onto the screen, where its sinusoidal motion reflects that of the cantilever. The motion of the laser point (keeping the number of bounces constant) was recorded at 1200 frames per second using a Casio Exilim Pro EX-F1 Digital Camera for each point along the length, moving at approximately one centimeter increments and recording the position of the center mirror relative to the cantilever base.
Results
The calculated values for $k$ show a positive, highly linear pattern. This results in the series of harmonic frequencies growing at an exponential rate. This created difficulties during the experimental phase; rapidly increasing frequencies caused a proportional drop in power/amplitude and made harmonics above three undetectable with our equipment. Increasing the amplification caused by the optical lever system to the degree needed to "see" those modes resulted in too great an uncertainty to be useful.
File:Data Record.pdf
 [[File:NonFirstFour.jpg]
Each eigenmode has one more node than the previous, starting with no nodes at all on the fundamental frequency. These were clearly visible on the lower harmonics. Because the absolute value of amplitude depends on power, these model-predicted functions need to be scaled to the experimental data and considered in terms of relative amplitude. The eigenmodes for cantilevers of nonuniform shape are similar to the uniform ones in overall shape and number of nodes, but show idiosyncrasies of increasing severity in correspondence with sharp changes in width. For example, a square wafer like the one to be used in the GlueX experiment shows a shift in the location of its nodes towards the slimmer ends of the cantilever, while a more slender shape shows much less of a shift.
Conclusions
Work on this project, like the overall GlueX project, is still ongoing. Current endeavers include comparing the experimental data to the results predicted by the models, in order to quantify any discrepancy there and determine possible improvements. Other considerations include improving the optical lever system, which reported data with too high an uncertainty value to consistently measure more than three modes above the fundamental frequency. The high uncertainty was mostly caused by scatter in the laser; this could be improved with the use of a laser with a higher Q factor or by decreasing the frequency of imperfections on the surface of the cantilevers.


