LH Independent Study Spring 2013
This semester I worked with Ann Marie in 405 for 2 hours a week for a 1-credit Independent Study (PHYS 4099).
By working in the lab with Ann Marie, I have learned a lot about the Tagger Microscope Construction project for Jefferson Lab. And my work regarding the project has been mostly testing the scintillating fibers and light guides during and after the fusing process. After covering the basic tasks of cutting and measuring fibers, I assisted Ann Marie in taking the data for the Alcohol Test, Strength Test, and Heat Test. I also analyzed the average width at fusing sites for when Jim had to re-create the drawing for the glass ferrules.
Alcohol Test
In this experiment, 10 Scintillating Fibers and 10 Light Guides were placed in varying solutions of either isopropyl alcohol or ethanol. Each fiber was cut and measured length-wise and width-wise before and after sitting in solution. The masses of the fibers were also recorded before and after.
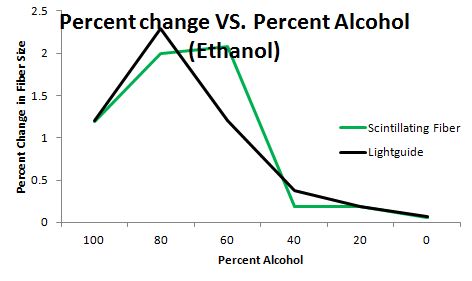
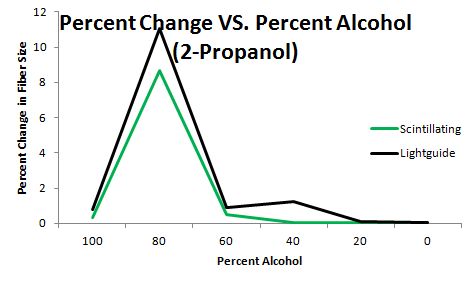
Below are the graphs Ann Marie created. They show the percent change in fiber size vs. concentration of the solution (ethanol and isopropyl alcohol respectively). It is clear that some sort of chemical reaction or corroding effect is occurring when the fibers were set in 60% and 80% ethanol and 80% isopropyl. It is also worth noting that when measuring the fibers that had set in the previous solutions, the cladding of the fibers were very clearly coming off of the fibers. I found out May 9th that Ann Marie has done another Alcohol Test with heat, but I have yet to see any of the results, but I've heard that the 80-60% assumption has been disproven
Strength Test
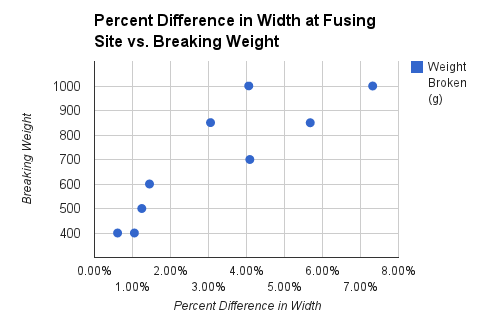
For the Strength Test, Ann Marie had fused together 11 scintillating fibers to 11 light guides and tested their strength by hanging a mass from their fused joint. After successfully breaking 10 of the joined fiber/guides, it appeared as though the strongest fibers were the fibers that had the greatest cross sectional widths at the fusing joints, as suggested by the graph below.
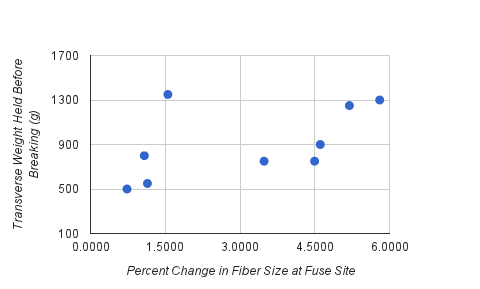
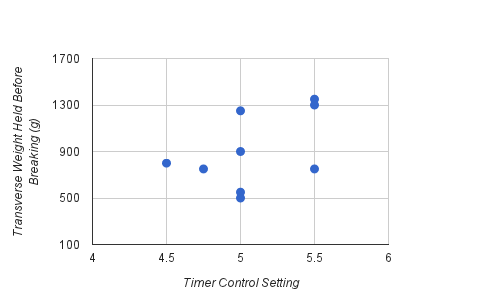
However, Ann Marie then conducted a second strength test in order to test if the fusing joints size were a proper indicator of the fusing. This time she recorded the time and amount of pressure used during the fusing process. Again, she broke the fibers using the same method. This test showed that there is not a correlation between fusing site width and fused fiber strength. It also suggests that there is not a correlation between Time Control during fusing and resulting fiber strength.
Strength Test 2 Drive Document
Average Fiber Widths
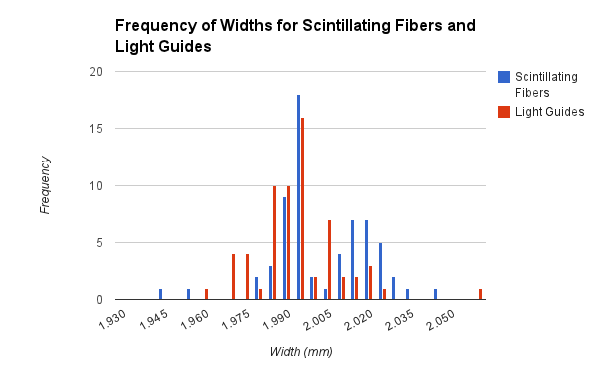
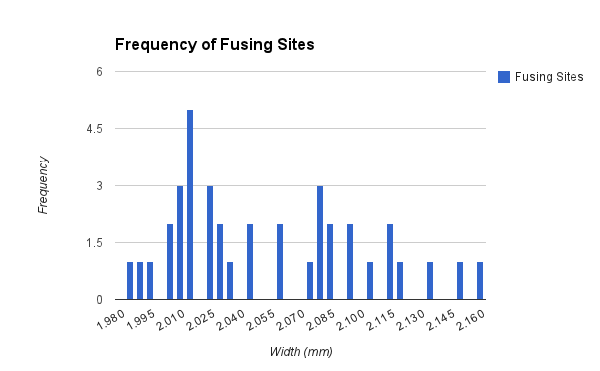
Using measurements taken from the Alcohol Test,Strength Test 1, Strength Test 2, and the Heat Test, I created a new excel spreadsheet where I could analyze the average widths of SciFis, Light Guides, and their Fusing sites. Below are their histograms.
The average of the 64 measurements of Scintillating fibers was 2.00035 mm, with a standard deviation of 0.01814 mm. The average of the 64 measurements of the Light Guides was 1.99184 mm with a standard deviation of 0.01596 mm. 85.94% of the SciFi measurements were within one standard deviation of the mean, and 95.31% were within two standard deviations. 71.88% of the Light Guide measurements were within one standard deviation of the mean, and 98.44% were within two standard deviations of the mean.
The average of the 38 measurements of fusing sites was 2.05139mm, with a standard deviation of 0.04706 mm. 73.68% of the measurements were within one standard deviation and 97.37% of the measurements were within two standard deviations. From the graph and the comparison of standard deviations between the previous two graphs, I can tell that there is a greater variability in the widths of the fusing sites than the individual fibers themselves. This is likely due to the fact that the fusing site has yet to be automated.
Heat Test
For this experiment, we were testing to see if the fibers could withstand various temperatures. I cut 4-1cm light guides and 4-1cm scintillating fibers. I measured their lengths and widths. The fibers were tested under 4 conditions: 180 deg Fahrenheit with distilled water, 150 deg F with distilled, 180 deg F with tap, and 150 deg F with tap.
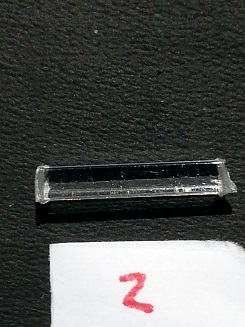
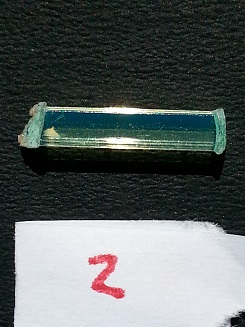
On Monday, April 29th, the 150 degree F tap and distilled fibers were placed on a hot plate and set for approximately 50 hours. They were then removed from the hot plate and set to cool in a cabinet. The 180 degree F tap and distilled water was then placed on the hot plate on Wednesday, May 1st and left for approximately 50 hours.On May 2nd I measured the fibers from the 150 deg F tap and distilled and on May 3rd I measured the fibers from the 180 deg F tap and distilled. On May 3rd I also remeasured the lengths for groups 2 and 4 fibers because they had seemed significantly larger than what the fibers appeared to be. I personally remeasured with the vernier caliper again and had Ann Marie remeasure the lengths with the micrometer. I averaged the 3 lengths taken and used it as the final. May 3rd was also the day I took pictures of the all 4 groups of fibers.
One problem that arose during this experiment was the difficulty in maintaining the proper temperature for the water. The hot plate did not accurately represent the temperature of the water in the vials, so a third vial was set up with a thermometer inside to properly gauge the water temperature. However, despite this, the temperature still varied throughout the experiment. At some point on May 2nd, Jim had noticed that the vials were bubbling and checked the temperature to be greater than 180 deg F and closer to 200 deg F which may have caused a difference.
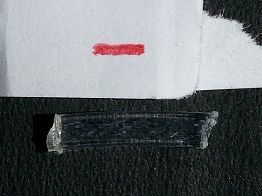
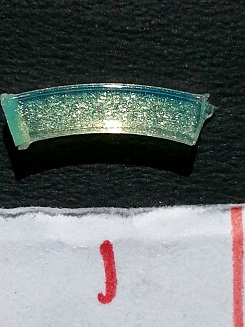
Another problem worth noting was that the 180 deg F fibers were arced (seen below), which may be due to the fact that they naturally rested on the bottom of the vials on the hot plate, so one side of the fibers possible got hotter and therefore expanded more than the other side, causing the fibers to bow. Because of this, I believe Ann Marie and I will be doing more heat tests.
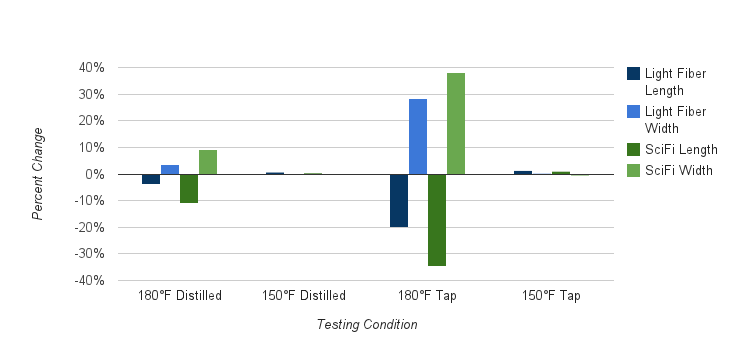
The chart above graphs the percent differences in length and widths of both the light guides and scintillating fibers in all four conditions. It is clear that the 150 deg F fibers had minimal percent differences, while the 180 deg F fibers underwent a much greater change. It is also worth noting that in the 180 deg F samples, the scintillating fibers had a much greater change in length and width than the light fibers.
