 |
 |
 |
| parameter | Gaussian 1 value | Gaussian 2 value |
| height | 6378 | 4191 |
| mean (GeV) | 4.732 | 4.355 |
| r.m.s. (GeV) | 0.266 | 0.495 |
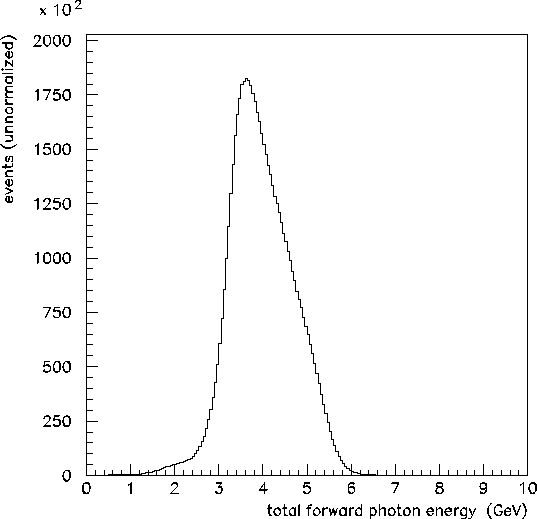
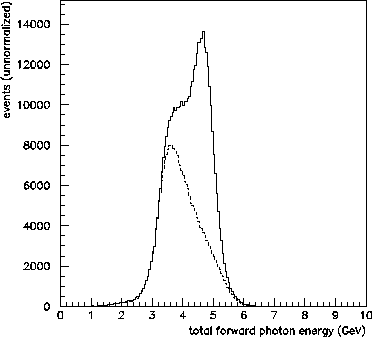
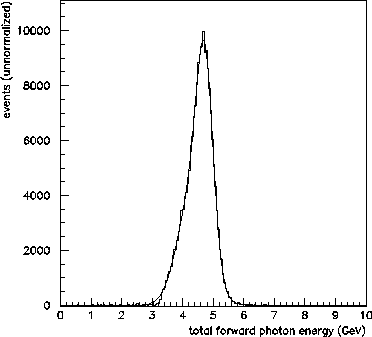
A test of above procedure would be to look at the total energy from all reconstructed showers in the forward calorimeter. This is a critical test, as can be seen from the total forward energy spectrum for all events shown in Fig. 5. The shape shows a threshold around 3 GeV coming from the online level-3 trigger, followed by a monotonically decreasing intensity with energy. Although the maximum energy is roughly consistent with the end-point energy of 5.65 GeV, there is very little evidence of an enhancement in the region of subtended by the tagger 4.39 - 5.38 GeV. Fig. 6 shows the same spectrum weighted by the tagger-cpv coincidences weight for tagging counter 10. The dashed histogram in the same figure indicates the corresponding spectrum for the accidentals for counter 10. The difference spectrum is shown in Fig. 7. The sum of two Gaussians gives an excellent empirical description of the spectral line-shape, with approximately equal numbers of events in the narrow spike at the maximum and the low-energy tail.
| tagging channel | nominal mean (GeV) | mean (GeV) | r.m.s (GeV) |
| 0 | 5.360 | 5.200 | 0.280 |
| 1 | 5.310 | 5.160 | 0.288 |
| 2 | 5.210 | 5.120 | 0.278 |
| 3 | 5.190 | 5.060 | 0.276 |
| 4 | 5.140 | 5.030 | 0.270 |
| 5 | 5.090 | 4.960 | 0.273 |
| 6 | 5.040 | 4.910 | 0.263 |
| 7 | 5.020 | 4.880 | 0.254 |
| 8 | 4.940 | 4.820 | 0.261 |
| 9 | 4.880 | 4.770 | 0.264 |
| 10 | 4.830 | 4.730 | 0.267 |
| 11 | 4.770 | 4.670 | 0.259 |
| 12 | 4.710 | 4.600 | 0.250 |
| 13 | 4.640 | 4.550 | 0.251 |
| 14 | 4.590 | 4.510 | 0.253 |
| 15 | 4.550 | 4.480 | 0.253 |
| 16 | 4.510 | 4.430 | 0.248 |
| 17 | 4.460 | 4.380 | 0.255 |
| 18 | 4.410 | 4.350 | 0.246 |
 |
Fits like the one shown in Fig. 7 have been performed for all of the tagging channels. All channels exhibit a spectral shape similar to the one shown in the figure. Table 2 shows the fit parameters for the narrow Gaussian peak, and compares it with the energy calculated based upon the tagging channel. While not perfect, the agreement between the peak energy and the mid-energy for the given tagger channel is impressive when it is remembered that the energy calibration was based entirely on the invariant mass scale of two-cluster combinations. This is the first time that the total energy scale in the LGD has ever been verified.
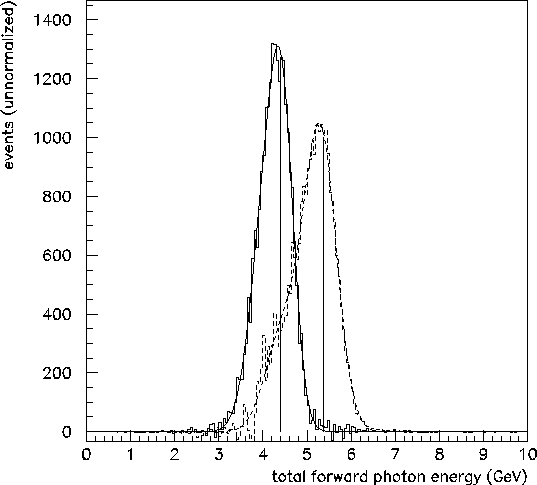
The above spectra are all taken for the case of two-cluster events. Similar plots are obtained for events with higher multiplicities, albeit with slightly larger r.m.s. values as expected based on the known calorimeter resolution. Fig. 8 compares the subtracted total-energy spectra for the highest and lowest counters in the tagging focal plane. The correspondence with the energy computed based upon the tagger channel is similar to the two-cluster case, systematically low by about 100 MeV. An offset of this order is expected in order to account for the energy carried away by the recoil proton.
A comparison of the shapes of
the two spectra in Fig. 8 shows that there is a
significant tail on the low side of the resolution function,
perhaps indicating some loss of energy out the sides of the detector
combined with the effects of dead channels that appeared throughout
the run, but mainly explained by the distribution of the kinetic energy
transfered to the recoil proton. The tail is less prominent in the
spectrum from the low energy end of the tagger only because it is
truncated by the online level-3 threshold around 3 GeV.
The widths of the narrow peak listed in Table 2
are in good agreement with the r.m.s. expected on the basis
of the empirical resolution function [2] for single
showers