


Next: Conclusions
Up: mc
Previous: BGV handle
The next hypothesis to consider is that missing photons are hiding in the LGD.
Maybe we fuse two photons into a single cluster, or maybe we are not seeing
them at all due to inefficiency in the cluster recognition.
To examine this, we again compared the simulation with the reconstruction
in the LGD. From simulation, we use low angle photons (LAP) that have
polar angle  . Fig. 7 (right) shows the
energy distribution of clusters (black) and low angle photons (red) from
the
. Fig. 7 (right) shows the
energy distribution of clusters (black) and low angle photons (red) from
the  reactions (mostly
 ) reconstructed
as
) reconstructed
as  .
Green and blue histograms show the LAP contribution when
.
Green and blue histograms show the LAP contribution when  and
and  . The right plot on Fig. 7 shows the LAP
multiplicity for the given cuts. We see a good agreement between photons
and clusters except for very high and very low energy photons.
At high energy the disagreement is probably because we fuse some soft
photons to a high energy cluster. In the low energy region there is a clear
threshold effect. If we can teach the clusterizer to search for soft photons
in the LGD we should be able to suppress the background.
. The right plot on Fig. 7 shows the LAP
multiplicity for the given cuts. We see a good agreement between photons
and clusters except for very high and very low energy photons.
At high energy the disagreement is probably because we fuse some soft
photons to a high energy cluster. In the low energy region there is a clear
threshold effect. If we can teach the clusterizer to search for soft photons
in the LGD we should be able to suppress the background.
Figure 7:
The energy of clusters and low angle photons (left) and LAP multiplicity
(right) in the case of events from reactions.
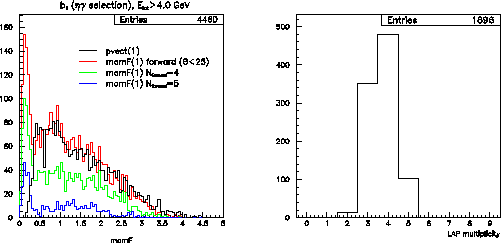 |
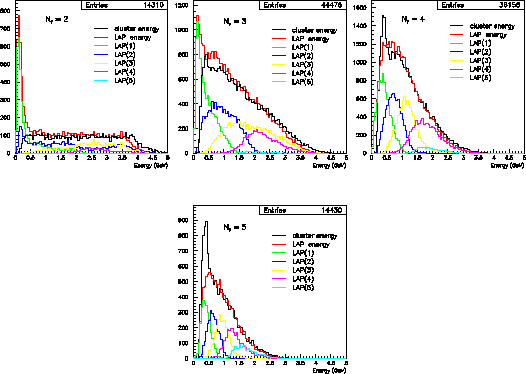
Fig. 8 shows that this will not be an easy task.
We compare cluster (black) and LAP (colored) energy
for different cluster multiplicities from the same reactions
and general requirements  ,
,  GeV
(no
GeV
(no  selection).
The red histograms represent the total LAP contribution for the given
number of clusters. The other colors represent LAP's ordered by their energy.
Again, we have agreement between clusters and mid-range energy photons;
however we can have more then 3 photons even when we see just 2 clusters.
In the case of 2 clusters, merging of clusters is particularly visible for
high cluster energies. The generator produces essentially no photons
above 4 GeV, while the reconstructed cluster energy distribution extends
above 4.
In the case of 4 and 5 clusters, a peak in the cluster energy distribution
in the range 300-500 MeV comes from charged particles from the
selection).
The red histograms represent the total LAP contribution for the given
number of clusters. The other colors represent LAP's ordered by their energy.
Again, we have agreement between clusters and mid-range energy photons;
however we can have more then 3 photons even when we see just 2 clusters.
In the case of 2 clusters, merging of clusters is particularly visible for
high cluster energies. The generator produces essentially no photons
above 4 GeV, while the reconstructed cluster energy distribution extends
above 4.
In the case of 4 and 5 clusters, a peak in the cluster energy distribution
in the range 300-500 MeV comes from charged particles from the
 channel.
Figure 8:
Comparison between cluster and LAP energy for different cluster
multiplicities from reactions.
 |
Next: Conclusions
Up: mc
Previous: BGV handle
Mihajlo Kornicer
2001-11-30