The Radphi analysis code that calculates the penetration depth of the showers in the LGD is found in the file makehits/makePhotonPatch.c. The relevant part of the code, as it exists now, is shown below.
------------------------------
#define TARGET_TO_LGD_DISTANCE 108.0
#define ZMAX_MULT 1.06
#define ZMAX_COEFF 4.52
#define E_CRITICAL 0.01455
...
  zMax = ZMAX_MULT*ZMAX_COEFF*log(cluster->energy/E_CRITICAL);
------------------------------
 |
 |
 |
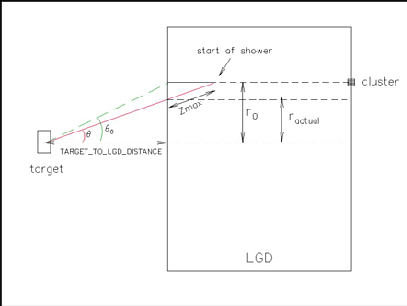
The meaning of the parameter zMax is shown in Fig. 3.
Further down in the code it is used to project the measured ![]() of the cluster onto the plane defined by
of the cluster onto the plane defined by
![]() =
=TARGET_TO_LGD_DISTANCE which nominally corresponds to the
front face of the glass. The calculated value of zMax may be
used to find the ![]() coordinate (beware the notation) of the shower
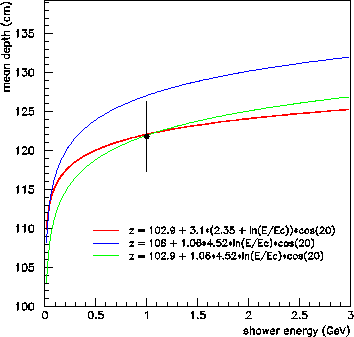
centroid according to Fig. 3. This is shown in Fig. 4.
The blue curve represents the code listed above. The data point and
error bar represent the Monte Carlo distribution from Fig. 2
rotated to 20
coordinate (beware the notation) of the shower
centroid according to Fig. 3. This is shown in Fig. 4.
The blue curve represents the code listed above. The data point and
error bar represent the Monte Carlo distribution from Fig. 2
rotated to 20![]() . The blue curve misses the data because the value
of
. The blue curve misses the data because the value
of TARGET_TO_LGD_DISTANCE is too large. Survey measurements give
102.9cm for this parameter. Just changing that parameter gives the
green curve. The red curve is just Eq. 3 applied to an
incidence angle of 20![]() .
.