One of the conclusions from this study is that the backgrounds in the Radphi
experiment are mostly soft electromagnetic debris. The gamma ray flux is
more intense than that of the ![]() component at low energies (a few MeV)
by a factor of roughly 3. However the charged particle spectrum is harder
than the X-rays, so that at energies above 50MeV, the background is mostly
charged particles. These charged tracks are most intense at low angles, but
their distribution reaches out far enough to cause concern about pileup
effects in the LGD. This section presents quantitative estimates of these
effects.
component at low energies (a few MeV)
by a factor of roughly 3. However the charged particle spectrum is harder
than the X-rays, so that at energies above 50MeV, the background is mostly
charged particles. These charged tracks are most intense at low angles, but
their distribution reaches out far enough to cause concern about pileup
effects in the LGD. This section presents quantitative estimates of these
effects.
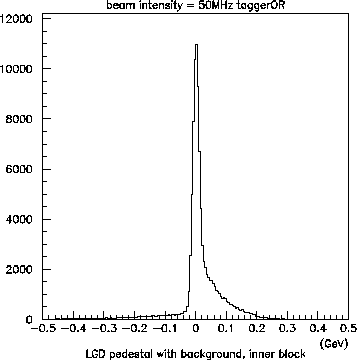
There are two effects we can expect from pileup: degraded resolution from blocks that are part of a cluster, and extra clusters. First I consider the effects of degraded resolution. These can be estimated simply by looking at the ADC spectrum of a block that does participate in a cluster. This "pedestal" distribution is implicitly convoluted with the measured energies blocks that do participate in a cluster, so it is there whether or not the block is hit. By looking at the pedestal distribution for blocks far from a shower center, the measurement error from pileup can be observed directly. In Fig. 11 is shown the pedestal distribution for one of the 8 blocks closest to the photon beam axis. The tail on the high side of the peak comes from accidental coincidences between the event trigger and an uncorrelated hit (mostly electron/positron tracks) that falls within the ADC gate. The gate is assumed to be 250ns wide. The tail on the low side of the peak comes from accidental coincidences between the event trigger and an uncorrelated hit (mostly electron/positron tracks) that falls within the pre-sampling interval used by the ADC to set its zero. This pre-sampling interval is assumed to be 50ns in the Monte Carlo simulation.
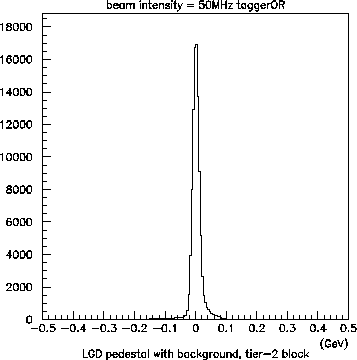
The same distribution is shown in Fig. 12 for blocks that are adjacent to the 8 innermost LGD blocks. The intrinsic width of the pedestal was set to 10MeV (electronic noise) in the simulation. These plots are similar to what was shown by Scott Teige from data taken during 1998 running. From them we can conclude that pileup is most significant for the inner blocks, as expected. What is not so obvious from just looking at Fig. 12 is that the r.m.s. of the pedestal is more than doubled by the background, the effect of the broad wings under the peak. Once 6 or 7 blocks with such pedestals are added together, the residuals become Gaussian and are determined only by the r.m.s. of the constituent measurements, and not by the f.w.h.m., for example. Thus, we can expect pileup effects to determine the limiting resolution of the LGD for showers in the central region. A figure for tier-3 blocks is not shown, but the pedestal r.m.s. for blocks in that region was determined to be broadened from 10MeV to 14MeV by pileup. Beyond tier-3 pileup can be assumed to be negligible. This also implies that one can neglect pileup effects in the BGV.
 |
 |
The degradation of LGD resolution from pileup in the inner few tiers of blocks can be ameliorated by reducing the width of the ADC gate. At this point it is not possible to reduce the pre-sampling interval below its present value of 50ns. However, if the gate width is reduced from 250ns to 125ns, the r.m.s. width of the pedestal is reduced by a factor of 1.5.
The second effect from pileup has much more serious implications for the
experiment. Since there is no timing information from the LGD wall, all
hits in the lead glass that occur within the interval of the ADC gate must
be considered to be a part of the event. Let it be presumed that a given
set of clusters constitutes a desirable event, according to some analysis
criteria. That event will be spoiled by any hit, charged or neutral,
above the cluster-energy threshold that occurs within the ADC gate. As
mentioned previously, the hard part of the background is essentially all
electron/positron tracks below ![]() . The rate for these is considerable,
as can be seen from Table 4. The rate of clustered centered in
the innermost blocks has been listed separately because these blocks are
treated differently by the cluster finder. But even excluding these blocks,
these numbers indicate that pileup of charged shower clusters within the
ADC gate makes a real difference in terms of our acceptance.
. The rate for these is considerable,
as can be seen from Table 4. The rate of clustered centered in
the innermost blocks has been listed separately because these blocks are
treated differently by the cluster finder. But even excluding these blocks,
these numbers indicate that pileup of charged shower clusters within the
ADC gate makes a real difference in terms of our acceptance.
This acceptance deficit from pileup in the LGD has not been included in the calculation of total signal to tape presented earlier in this note. Since the effect is rate-dependent, in principle it should be included, because it is the number of reconstructible events that one would like to optimize by adjusting the beam intensity. However, it is possible for us to decrease the ADC gate and diminish the pileup effects. Reducing the fractions in Table 4 by a factor of 2 would make a significant difference to the statistics of reconstructed events collected by the experiment. I propose that tests be made early during the 1999 run period, with a goal of reducing the ADC gate width to the vicinity of 100ns.
| average number of accidental clusters | ||
| threshold | everywhere | excluding inner 8 blocks |
| 70 MeV | 1.35 | 0.45 |
| 100 MeV | 0.65 | 0.19 |
| 150 MeV | 0.25 | 0.07 |