File:FinalPreampVpowerGainCurve.png
Jump to navigation
Jump to search
No higher resolution available.
FinalPreampVpowerGainCurve.png (695 × 322 pixels, file size: 5 KB, MIME type: image/png)
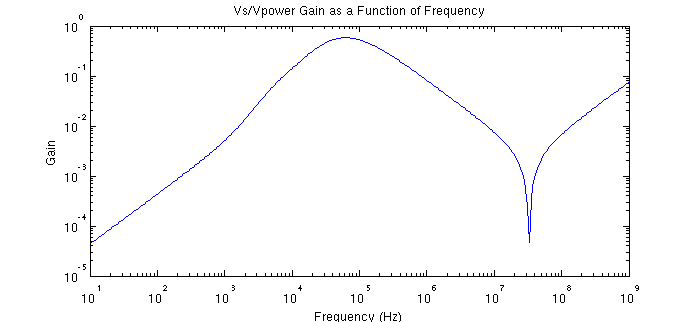
This plot shows the gain of Vs (summer output voltage) to Vpower (power supply voltage) as a function of frequency using the MATLAB model of the final production preamplifier board.
File history
Click on a date/time to view the file as it appeared at that time.
| Date/Time | Thumbnail | Dimensions | User | Comment | |
|---|---|---|---|---|---|
| current | 19:12, 3 December 2013 | | 695 × 322 (5 KB) | Barnes (talk | contribs) | This plot shows the gain of Vs (summer output voltage) to Vpower (power supply voltage) as a function of frequency using the MATLAB model of the final production preamplifier board. |
You cannot overwrite this file.
File usage
The following page uses this file: