File:Energy Time.png

Original file (910 × 663 pixels, file size: 28 KB, MIME type: image/png)
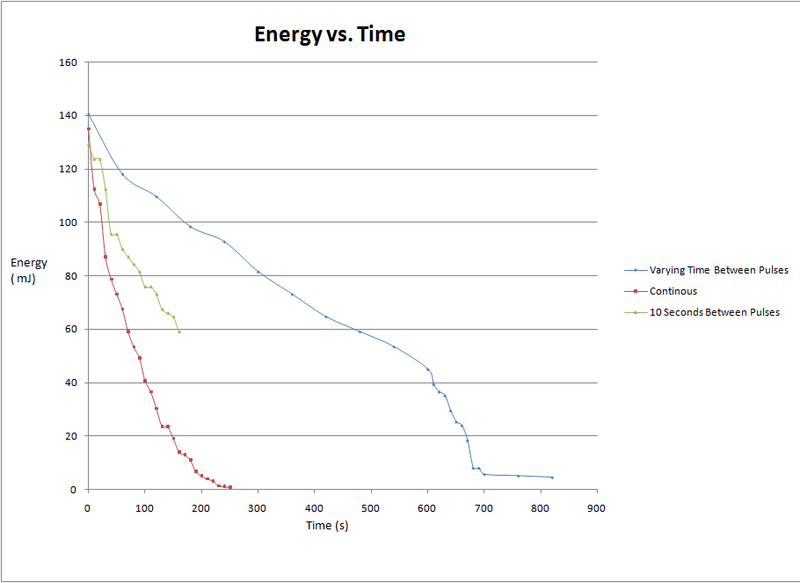
Notice that as the amount of time between the H.V. states 0 and 26kV increases, the rate of energy loss decreases. The blue line (Varying pulses) indicates when there were 1 minute intervals between 0 and 26kV states. The line shows that the energy decrease is dominated by the number of pulses instead of how long it spends in the gas processor. Also notice, between the 600-700s mark of the same blue line a sharp drop in beam energy. This is when the interval between 0 and 26kV was changed from one minute to 10 seconds; reinforcing the idea of pulse dependency. The other two lines (red=H.V. set to 26kV continuously, green=H.V. changed from 0 to 26kV every ten seconds) drop at a very similar rate being that their total number of pulses are similar.
File history
Click on a date/time to view the file as it appeared at that time.
| Date/Time | Thumbnail | Dimensions | User | Comment | |
|---|---|---|---|---|---|
| current | 16:07, 2 June 2010 | | 910 × 663 (28 KB) | Bpratt18 (talk | contribs) | Notice that as the amount of pulses per unit of time increase (time between 0 and 26kV) the rate of energy loss increases. |
You cannot overwrite this file.
File usage
There are no pages that use this file.