Development of a Direct Imaging Technique for Vibrational Analysis
Video Analysis
Originally, it was our intention to perform interferometry to analyze the diamond vibration. After several attempts to use the interferometer, it was determined that the vibration amplitude was simply too high to perform interferometry. Instead, a direct imaging technique was used to analyze the diamond vibration. An interesting phenomenon occurred when the direct imaging device was used. The reflected spot entering the camera lens created an artifact known as a lens flare. Typically lens flares are undesirable, but in our case, the lens flare movement directly correlated to the movement of the reflected beam spot on the lens surface. By careful calibration, the pixel movement on the image versus the angular displacement of the diamond surface was determined.
Calibration Set-Up
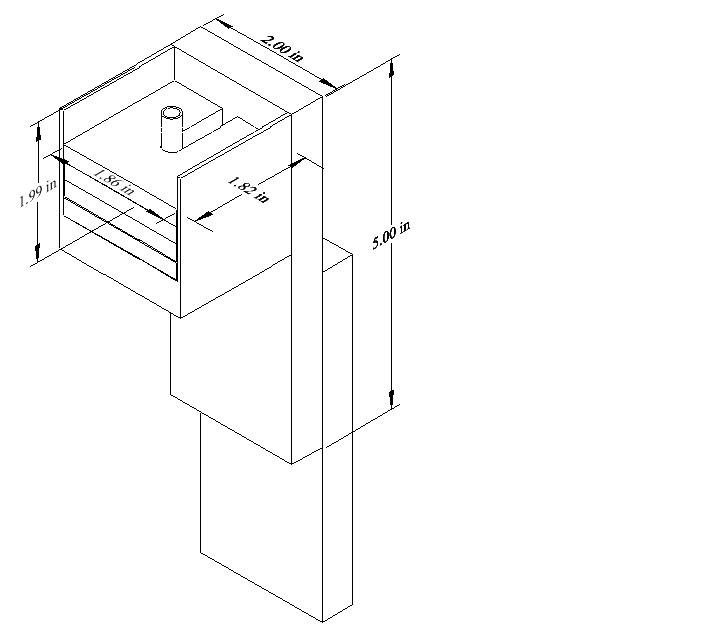
The following is an image of the device used for the camera calibration:
IMAGE OF CALIBRATION DEVICE
This calibration device was used to determine the change in pixel location of the center of the lens flares based on angular displacement. To do this, the camera was mounted horizontally on a 1.40m long bar. The camera end was free to rotate about a pivot located at the opposite end of the rod, above which a mirror was mounted. A linear micro-adjustment translation stage was placed below the camera end.
Tensioning device
After several failed attempts to tension the wires, it was determined that the amount of manual contact with the fibers was causing them to break. To remedy this issue, a tensioning device was developed.
The device allows us to apply different tensions by changing the number of weighting plates used.
Image Analysis
A high-speed (1200fps)video of the movement of the flare spot was then taken and analyzed using a fitting program. of the large number of images, a batching process was developed to aid in the video analysis. First, a built in Linux program, ffmpeg, separates the video into individual frames. Next, a program was developed to determine the center of th flare spot for each image. To find the location of the center of the flare, several lines of code were implemented:
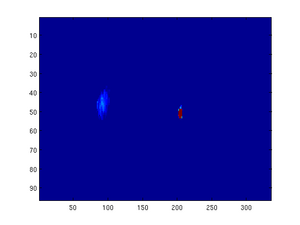
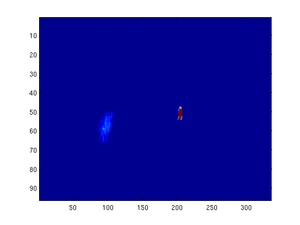
This program imports images with the name beginning with fnameref, starting with fnameref-initial.bmp . The program then converts the image into a matrix of intensity values and separates out the green channel. The plot for this channel is then images in flase color, with intensity ranging from low (blue) to high (red). The bright center spot is the point-to-point image of the illuminated diamond wafer. This spot remains fixed (the diamond is not really moving in space, simply rotating about fixed axes). Since this bright spot is many times brighter than the flair spot we are trying to investigate, we artificially mast this location out, so that the fit does not consider those points.
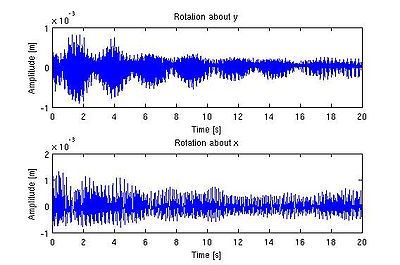
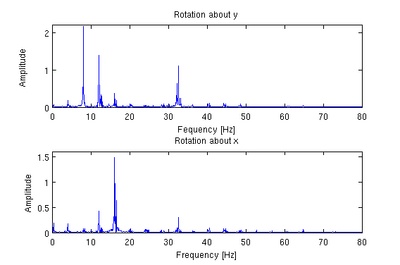
The program then fits the intensity value to a Gaussian (called as gauss2(n,m,par)) and uses this fit to find the center of the image flare. Since it is possible for the flare spot to be located outside the frame of the image, several checks are performed to ensure that the location which the program concludes is plausible. If not, the program notes the check failure in a vector known as badvec (originally a vector of all 1’s) by placing a 0 at the cell corresponding to number of the failed fit. The Gaussian program then fits the actual intensity to the fit intensity at each pixel. Suitable shape and amplitude parameters for the flare spots were chosen based on analysis of individual images. Once the fit is complete, the program put the x and y location for an image in a matrix called pars, with the x location in column 1 and the y locations in column 2. The program loops this fitting procedure until all the images have been fit. Once the fit is complete, the mean value for the x and y positions are subtracted from their respective columns and the data points are scaled (using the data received from the camera calibration) to obtain the deflection of the glass from center. We can also find the frequency components of this vibration by taking the Fourier transform of the amplitude plot.
