Difference between revisions of "Construction of the Full-Scale Tagger Microscope"
| Line 122: | Line 122: | ||
Two different alcohols, ethanol and propanol, were measured out and mixed with tap water to create different concentrations. In the first 5 vials were concentrations of ethanol, the next five were concentrations of propanol, and in the last vial was tap water only. The fibers destined for the vials were cut, measured cross-sectionally and lengthwise, and weighed with a milligram scale. Both scintillating fibers and lightguides were tested. | Two different alcohols, ethanol and propanol, were measured out and mixed with tap water to create different concentrations. In the first 5 vials were concentrations of ethanol, the next five were concentrations of propanol, and in the last vial was tap water only. The fibers destined for the vials were cut, measured cross-sectionally and lengthwise, and weighed with a milligram scale. Both scintillating fibers and lightguides were tested. | ||
| − | + | One lightguide and one scifi were put into each vial, and the vials were left to sit in a dark climate controlled area for two weeks. After the two week period, the fibers were drained, left to dry, and measured/weighed again. The raw data, as well as the plotted results, can be seen by clicking on the link below. | |
[[Alcohol Test 1]] | [[Alcohol Test 1]] | ||
| − | As can be seen from the plots of the data the greatest change in the size of the fibers occurred when the fibers were soaked in 80% alcohol. The most interesting thing, I think, to be learned here is that there seems to be a greater change in the fibers that were soaked in 80% alcohol as opposed to the ones soaked in 100% alcohol. My guess is that there were impurities in the tap water that acted as catalysts in the reaction, but the reason could be any number of things | + | As can be seen from the plots of the data the greatest change in the size of the fibers occurred when the fibers were soaked in 80% alcohol. The most interesting thing, I think, to be learned here is that there seems to be a greater change in the fibers that were soaked in 80% alcohol as opposed to the ones soaked in 100% alcohol. My guess is that there were impurities in the tap water that acted as catalysts in the reaction, but the reason could be any number of things. |
| − | |||
| − | |||
== Strength Test == | == Strength Test == | ||
Revision as of 18:35, 15 April 2013
Preparations for Construction of the Full-Scale Tagger Microscope
Current Work
- Determine an ideal process to assemble components of the fiber splicing unit.
- Optimize and document a reliable, repeatable process for fusing 2mm x 2mm square optical fibers using a fiber splicing unit.
- Work with James McIntyre to develop polishing, gluing, painting, and quality assurance procedures for optical fibers.
- Develop/refine a LabView program that controls a water heater and water pump based on water temperature.
A List of Specifications/Manuals for Items in Lab 405
Net Booter Quick Start Pamphlet
Ultra Black Silicone Adhesive (gasket maker)
Pictures
From Summer 2012:
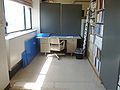
Preparing for construction.
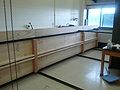
Just before the shelving was erected.
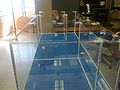
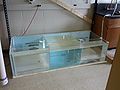
Construction of the tank to be used in fiber bending.
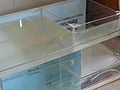
Testing the strength of the tank.
testing...
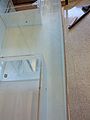
Here it is easy to see the bowing from water pressure.
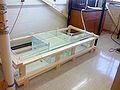
Tank with wooden supports.
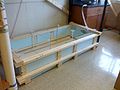
Tank with support and insulation. Plumbing and hot water testing are the next goals.


LabView Program
During the summer of 2012, Ben Willis wrote a LabView program that would communicate with a NetBooter and ultimately control a heater and water pump. LabView also plots the temperature of water being heated, and plots the changing temperatures on a graph on the front panel. Before Ben left, he wrote a final report of his work on the program and in the lab in general. I have added a little to Ben's work, mostly housekeeping; deleting some non functioning commands, adding the equation to represent temperature based on voltage, adding an equation for a thermocouple, and connecting with the DAQ. I also plan to make a differential op-amp to allow the DAQ to read the inputs given by the thermocouple. In this way, we will be able to use a thermistor and two thermocouples to control the water temperature in both the straightening pipe and the bending tank.
I had found a lab manual from the University of Minnesota that gave step by step instructions for taking and recording temperature measurements using a thermistor, a DAQ, and LabView. After making the circuit and updating the LabView program it seems to be working within expected error.
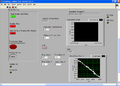
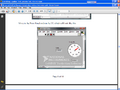
The front panel of the LabView program.
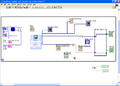
Part 1 of the block diagram: The majority of this part of the program is to read the output given by the DAQ, translate it to a temperature, and plot the results.
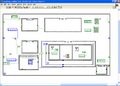
Part 2 of the block diagram: The main purpose of this part of the program is to determine if the temperature read from part 1 is what was specified in the front panel, and to turn the water pump and heater on or off as appropriate.


A view of the LabView front panel that Ben and I created. The voltage and temperature are actual readings/calculations that have been made.
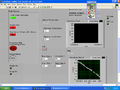
A view of the lab that inspired the thermistor idea. The numbers are a close comparison of the measured data in the previous picture.


Temperature Measurements
Along with the LabView program, another component of bending fibers will be to determine the temperature of the water and to make that information available to the program.
At first, I had thought that our best bet as far as reading/recording water temperature was to make a thermistor (as seen below).
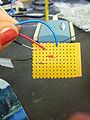
A temperature measuring circuit that included a voltage divider, a resistor, and a thermistor.
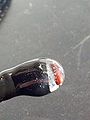
This is the same circuit as to the left, except it is free of a breadboard and water resistant.


Although this thermistor is reasonably accurate, I feel that it would be possible to have (already purchased) thermocouples read the temperature instead. The signal from the thermocouple would need to be amplified in order to be read by the DAQ we are currently using because the thermocouple produces voltages in the micro range. Using an operational amplifier and the right resistors I am confident that I would be able to achieve a strong enough signal from the thermocouple(given enough time). The remaining hurdle in this endeavor would be to tweak the LabView program to use the temperature-voltage relationship equation of a type J thermocouple instead of a thermistor.
Some great resources for thermocouple theory and circuitry can be found here:
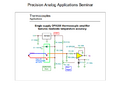
I feel that this is a place to start if I am to accurately read a thermocouple. Included in the circuit diagram is cold junction compensation and signal amplification; two things that are a requisite to accurate measurements.

After reading the material above, I have found two (cheap) ways to read a thermocouple accurately:
1. Create something in the software that compensates for the room temperature factor at the cold junction. If we end up using the thermistor to read the temperature at the cold junction then we will be introducing the error from one temperature measurement to another. Although the thermistor will read the water temperature within acceptable error, adding more error into the calculation seems unnecessary to me.
2. Follow the diagram above and create a hardware approach to cold junction compensation. After determining the voltage output of a type J thermocouple at zero degrees Celsius, I can introduce that voltage at the cold junction site. By following the circuit above, I would probably be able to construct a circuit that would have cold junction compensation and amplification for the signal. My concerns for this approach involve time constraints and the intricacies of this setup.
Although, after having found this, I think the problem may be solved.
Op amp designed for a type J thermocouple, with cold junction compensation
Completed Work
- Clean and organize room P405.
- Hot water tank constructed - still awaiting testing
- Splicing unit collars redesigned
- A program was written to automatically control a heater/pump based on the temperature of the water.
Miscellaneous Fiber Testing
Alcohol Test
Poly(methyl methacrylate), or plexiglass, was found to react to ethanol when used in high concentrations. When our fiber bending tank (made of poly) was being cleaned with pure ethanol, an obvious reaction was seen as crazing developed on the surface of the walls of the tank. Because our fibers are made from a similar material (polystyrene with flour-acrylic cladding) it seemed necessary to also test their reaction to exposure to alcohol.
Two different alcohols, ethanol and propanol, were measured out and mixed with tap water to create different concentrations. In the first 5 vials were concentrations of ethanol, the next five were concentrations of propanol, and in the last vial was tap water only. The fibers destined for the vials were cut, measured cross-sectionally and lengthwise, and weighed with a milligram scale. Both scintillating fibers and lightguides were tested.
One lightguide and one scifi were put into each vial, and the vials were left to sit in a dark climate controlled area for two weeks. After the two week period, the fibers were drained, left to dry, and measured/weighed again. The raw data, as well as the plotted results, can be seen by clicking on the link below.
As can be seen from the plots of the data the greatest change in the size of the fibers occurred when the fibers were soaked in 80% alcohol. The most interesting thing, I think, to be learned here is that there seems to be a greater change in the fibers that were soaked in 80% alcohol as opposed to the ones soaked in 100% alcohol. My guess is that there were impurities in the tap water that acted as catalysts in the reaction, but the reason could be any number of things.
Strength Test
In order to test the transverse strength of the fused bonds created with the splicing unit, fibers were fused and then broken in order to test their strength. The size of the fiber and the fused joints were measured and recorded as well as the mass that each fiber held on the fuse point before breaking.
Below is are links to the Google Spreadsheets of the raw data and graphs. It is interesting to note that, in the first test, the joints that expanded the most were also the joints that withstood the most transverse force. This may have been because the fibers that did not fuse successfully were the fibers that did not melt all of the way, and consequently did not fill up any extra space that may have been in the glass ferrule.
The expanded joints in the second test did NOT turn out to be good indicators of bond strength as I had previously thought.
Strength Test 1 (Completed April 4, 2013)
Strength Test 2 (Completed April 12, 2013)
Ferrule Measurements
In hopes of understanding the bulge in the spliced region of the fibers, the ferrules they are spliced in were photographed under a microscope and measured using a tracker program that allows for in-photo calibration and measurement. The ferrules were placed as perpendicular to the table as possible in order to get the most flat, head on shot of the ferrules. The error in the measurement of the angles was quite high. Moving the compass only a little bit (in the tracker program) lead to very different degrees read. Because of this I would estimate the angle to be off anywhere from +- 1-2 degrees. I would say that the lengths measured have an error on the order of +- .05-.1 mm
Lab Journals / Research Progress
Ann Marie's Lab Journal
In the past I had kept my journal in a Google Document.