Diamond Radiator Thinning Using an Excimer Laser
| Important Documents |
| UConn Laser Safety Manual |
| Excimer laser S.O.P. |
| Oxford GP 2000 User Manual |
Laser Thinning of Diamond
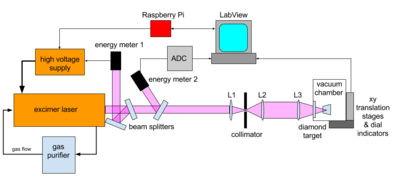
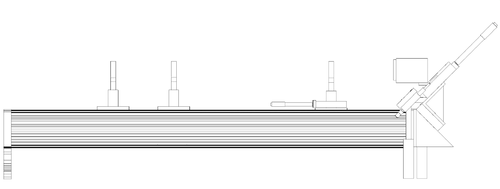
A research group at Brookhaven National Laboratory (BNL) published results using a focused high-power UV laser to mill diamond via a process known as ablation. Lasers with wavelengths above the band gap of diamond (213 nm) can excite electrons between the diamonds carbon atoms from a bound state to an ionized state. The top 100 nm of the diamond surface at the focal spot is instantly vaporized, emitting a plume of carbon-based plasma normal to the surface of the diamond crystal. By scanning the diamond across the focal spot, a sequence of overlapping spots is built up that results in uniformly milling the sample surface. The short duration (10 ns) and short absorption length (50 nm) of the laser pulse ensure that the pulse energy is absorbed in the upper 100 nm of the diamond and does not result in deep energy deposition in the bulk of the crystal. Most importantly, this technique allows the diamond to be thinned deferentially, creating a central window of 20 microns thickness while retaining the full thickness around the edges for stiffness and support. This would never be possible with an abrasive technique. The laser ablation technique on diamond was developed extensively here at UConn by the author, using a Lambda Physik EMG 101 excimer laser operating at a wavelength of 193 nm as the light source. An XYZ computer controlled stage was constructed to sweep the diamond (under a vacuum of 600 mtorr) across the laser focus. The bulk diamond crystal before machining is typically of size 7.2 x 7.2 x 0.250 mm^3 . A series of laser pulses was applied to a rectangular region in the center of the diamond, milling a thin window down to the required thickness and leaving untouched a zone around the perimeter which is called the frame. The components of the experimental setup shown in Figure 1 are discussed in detail in the sections below.
Excimer Laser
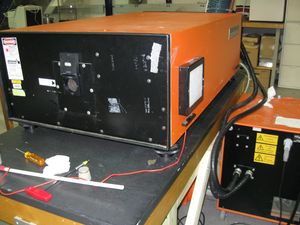
A Lambda Physik EMG 101 argon fluorine (ArF) excimer laser (shown in Figure 2) with an operating wavelength of 193 nm was used to ablate single-crystal CVD diamond. The laser is capable of delivering 120 mJ at a maximum repetition rate of 50 Hz and pulse duration of 20 nanoseconds. The pulse geometry is an asymmetrical flat top Gaussian with horizontal dimensions of 22 mm and vertical dimensions of 6 mm.
Gas Purification System
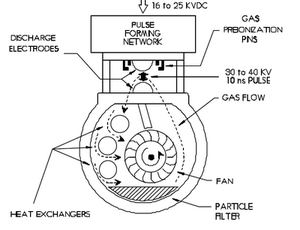
Excimer lasers produce UV light via the spontaneous/stimulated emission of an excited complex comprised of a halogen, noble and buffer (fluorine, argon and helium respectively). These pseudo-molecules are created inside the laser cavity by large electric fields and live for only a short period of time before photo-emission occurs. Afterwards, the halogen and noble gases undergo a refractory period during which they cannot be re-excited. The internal mechanics of the Lambda Physik EMG 101 excimer laser provides a continuous flow of fresh lasing medium into the laser cavity via a circulating fan. Figure 3 depicts the cross section of a typical excimer laser and illustrates the path of the laser gas medium. As shown, after the laser gas undergoes emission it passes over a series of heat exchangers. At repetition rates greater than 3 Hz a cooling unit must be run which passes 30◦ C de-ionized water through these heat exchangers. Once the hot gas is cooled it passes through particulate filters and is sent back into the laser tube to begin the cycle again. As this process continues the halogen component of the lasing medium reacts with the non-passivated metal released by the discharge of the laser cavity’s pre-ionization pins and other contaminants within the laser cavity. This contamination of the halogen gas reduces the average pulse energy of the laser until no lasing occurs and the 4 gas mixture must be completely replaced. For the purposes of laser ablating diamond, the laser gas medium is replaced when the average pulse energy is less than 50 mJ. Lambda Physik specifies this model laser can fire 400,000 pulses before the specified power reaches 50%. Assuming the laser starts at a maximum power of 120 mJ the laser would produce 480,000 pulses before it reached the minimum pulse energy of 50 mJ and had to be refilled. A 7.2 x 7.2 x 0.25 mm^3 diamond thinned with a central region of dimensions 6.7 x 6.7 x 0.02 mm^3 would require approximately 450,000 pulses per single complete pass over the diamond (assuming 0.5 mm s motor speed in x direction, 50 Hz laser repetition rate, and 0.01 mm motor step in y axis).
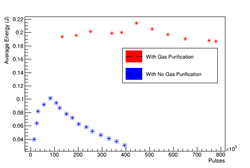
An average cut depth of 38µm per complete pass would estimate a total of over 2.6 million pulses to reach the final depth of 20 µm or roughly 7 complete laser medium fills. The ablation setup has methods to compensate for fluctuations in average laser energy so that the diamond surface remains smooth to within ± 0.5µm (these methods will be discussed in detail in a later section). However, even with these corrections, allowing the average laser energy to vary by 50% over the course of a single pass results in non-uniform ablation across the diamond which is too exaggerated to compensate for. It is then desirable to extend the lifetime of the laser gas medium so that average power remains constant over a single pass. Ideally, the laser would have a gas life time which exceeds the total number of pulses required to bring the diamond sample to 20µm. An Oxford GP-2000 cryogenic gas purification system and Millipore particulate filter were installed in a closed loop with the laser cavity as shown in Figure 1. The system pumps the laser gas medium through a liquid nitrogen cold trap removing contaminants generated during the lasing process, extending the laser gas life time by over an order of magnitude. The plot below shows the average pulse energy as a function of pulses completed. Figure 3 shows the comparison between running the laser with (blue) and without (red) the gas purification system. Using the gas purifier in line with the laser cavity resulted in an order of magnitude increase in number of total pulses fired. Also, the average output energy of the laser increased significantly due to filtration of halogen spoiling contaminants inside the laser cavity. In some cases only a single fill was required to ablate a diamond from start to finish-greatly reducing the surface variation on the diamond radiator and the cost of running the machine. It is conclusive to say that without the use of the gas purification system this laser would not be viable for use as a light source for diamond ablation purposes.
Laser Beamline
Figure 1 illustrates the arrangement of the ablation set up. A series of quartz plates are positioned immediately in front of the laser aperture so that a small sample of the beam (<5%) is reflected onto two separate energy meters labeled energy meter 1 and energy meter 2. Energy meter 1 is part of the laser’s on board energy feedback system which is used to control the output energy and stabilize the pulse-to-pulse variation to within 5%. Energy meter 2 measures each laser pulse incident on the diamond target during the ablation process.
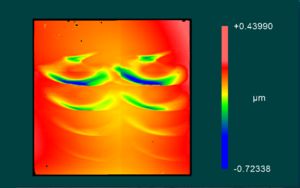
Figure 5a shows two columns of broad asymmetric patterns in a diamond sample cut using only a single lens for a varying number of laser pulses. If the focal spot that created these patterns was rastered over an entire diamond it would result in a radiator with large surface variations rendering it unusable for GlueX.
The focus of the laser defines the cutting tool with which the diamond is shaped. An ill-defined focused will ablate non-uniformly as the diamond is rastered across it making it extremely difficult to cut uniformly to 20 µm thickness without cracking the thin diamond membrane. The geometry of the focus also determines the fluence (laser energy per cm^2 ) incident on the diamond surface. A tightly focused beam spot increases the available fluence, increasing the rate of ablation. It is therefore very important to measure the waist of the beam after L3 in the three lens system. The laser beam then passes through a series of lenses as shown in Figure 4. Lenses L1 and L2 are positioned with overlapping focal lengths so that the output of L2 is a highly parallel, expanded beam. This was to remove large spherical aberrations due to imperfections in the quartz lenses.
Focal Spot Characterization
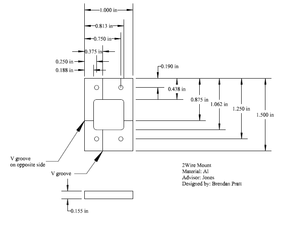
The focal spot was studied using a gold-tungsten harp scanner in both the x and y plane. Each harp scan was comprised of an aluminum mount machined at UConn and then anodized to insulate it from the 50 micron gold-tungsten wire that was stretched across it as can be seen in the CAD drawing below.
The total current produced is dependent on the flux of UV light incident to the wire and therefore proportional to the local intensity of the beam. Passing the wire through the beam waist creates a series of pulses from the gold-tungsten wire that rise and fall in amplitude, the peak defining the coordinate of the laser pulse maxima for that particular position of L3 (which is mounted on a translation stage moving in the direction of the beam path called z). An integrating circuit was designed and constructed to measure the sum of current off the gold-tungsten wire. The scans are done in pairs of 2d projections: xz (called x-scans) and yz (called y-scans). Between the scans the wire frame is swapped out because there are separate frames for the vertical (x-scan) and horizontal (y-scan) wires. The 2d scans consist of an inner loop over the transverse coordinate, and an outer loop over z. The transverse coordinate range is 2mm and the z coordinate range is 12mm. Each pass has a single value of z, and sweeps over the full 2mm range in x or y. The output of the integrating circuit is connected to an ADC which is sampling continuously over that the whole time period the scan is taking place
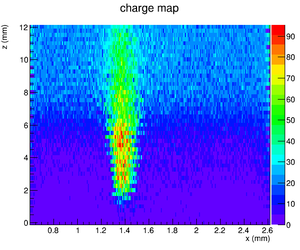
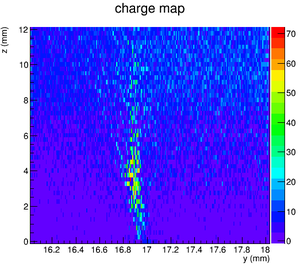
- Color maps of the two orthoganol scans of beam focal region, where the color represents the charge per pulse seen on the wire in arbitrary units.
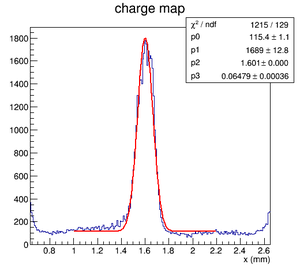
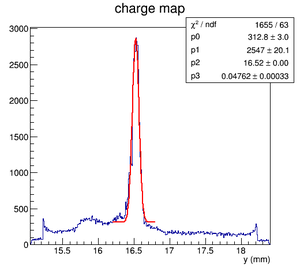
- Projections of the color maps shown in Figure 6 onto the transverse axis with Gaussian fits to central peak over a flat background.]]
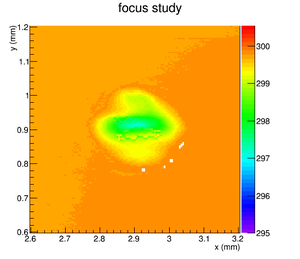
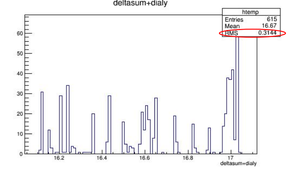
Each pixel in the plots shown in Figures 7 represents one laser pulse, with the color representing the pulse height integral. The lower-most row should be ignored because the scanning program was not yet fully synchronized to the raster pattern. The widths of the focal spot in x and y are shown in the RMS values of the fits in Figure 8. The values in x and y are roughly the same, 65 µm vs 48 µm respectively. Figure 7a shows a maximum intensity at a z position of 4.8mm, however it is interesting to note that the shape of the focal spot does not appear to change drastically away from this point. The optical setup has a narrow focal spot with a wide depth of field which is ideal for the purpose of laser ablation. From this study it was also concluded that the use of a collimator at the focal point of L1 and L2 greatly reduced the background seen by the harp scan and should be used during the ablation process to protect the diamond surface away from the ablation point
Ablation Rate
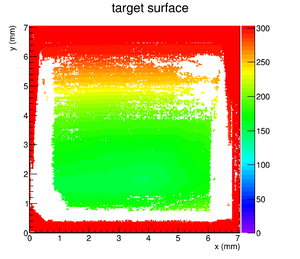
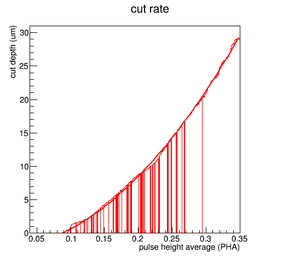
The ablation rate of diamond using 193nm light was measured under a vacuum of 650 mtorr. The laser power was gradually decreased as each row was completed so that the complete operation range could be studied. The ablated surface was then measured using a Zygo white-light interferometer and the cut depth values for each row were extracted. These values were used in the model shown below to calculate the expected cut depth of a row as a function of the average laser energy. The figures below show the Zygo image of the ablated surface and the modeled cut depth.
The histogram above was fitted with a second order polynomial and used to correct for fluctuations in the laser energy from row to row. Stacking laser pulses on top of each other increases the amount of diamond material removed within the region of overlap. This method was used to account for laser energy fluctuations while deferentially ablating diamond to within ±0.5µm surface variation.
FORTRAN Simulations of Beam Spot
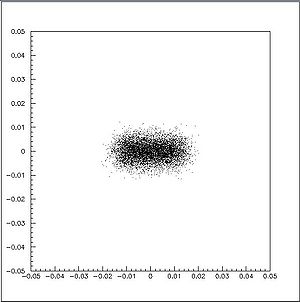
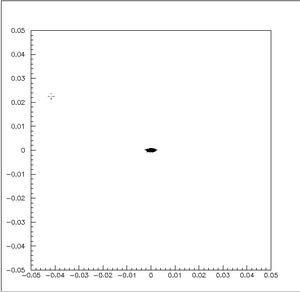
- A FORTRAN program has been written which simulates rays exiting the laser aperture and then propagating through a fused silica plano-convex lens. Using this program we can now observe the geometry of the beam as it passes through the focusing lens onto a target. We have seen that the beam leaving the laser aperture has a flat top distribution in the X plane and a Gaussian distribution in the Y. As the beam is focused both the X and Y projections achieve Gaussian distributions.
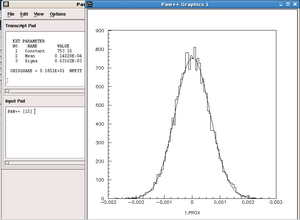
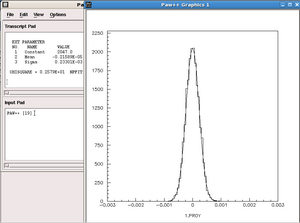
- Taking the X and Y projections of the focused beam and fitting them with a Gaussian distribution,we are able to attain and .
- Assuming a Gaussian distribution at the waist of the beam, we now find the FWHM (full width at half maximum) by the following relation,
- The smallest values of and were 1.49mm and 0.552mm respectively.
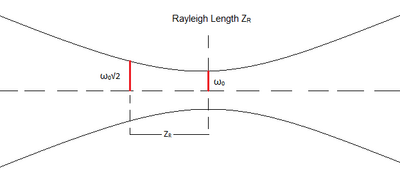
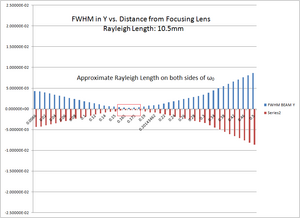
- The Rayleigh Length, is defined as the distance from the beam waist along the axis of propagation to the point where its cross section is doubled (). This value represents the "play" we will have when trying to focus the beam onto the diamond target for ablation. Taking as the beam waist, and using the as its value we are looking for the point where,
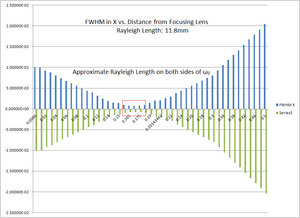
- Plotting as a function of distance away from the beam waist center, we find an average Rayleigh Length,
- and
- Knowing also allows us to calculate the theoretical fluence of the beam. Assuming maximum power of 220mJ over a 1.49mm x 0.552mm area yields Which is above the threshold value cited by Brookhaven National Laboratories who were conducting diamond ablation experiments with a 213nm Nd:YAG laser (213nm with the use of a 4 + 1 frequency mixing crystal). Our ArF excimer laser produces 193nm light that will be more readily absorbed by the surface of the diamond as diamond is opaque to wavelengths above the band gap. These calculations provide a level of confidence that we theoretically will be able to ablate diamond.
Ablation Chamber
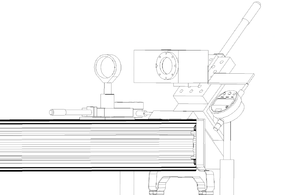
An aluminum vacuum chamber was machined at UConn to house the diamond during the ablation process as shown in the figure below. A roughing pumps was attached to one of the ports on the ablation chamber while a second port was connected to a digital flow controller and needle valve. This enabled the user to maintain a constant pressure to within 1 mtorr over the course of an ablation run. Vacuum pressures of a few tens of mtorr were achievable using this setup, however were not typically desired due to the large amounts of amorphous carbon build up after ablation occurred.
XYZ Translation Stages
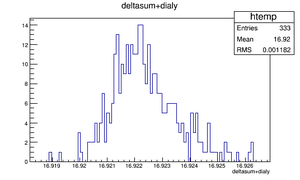
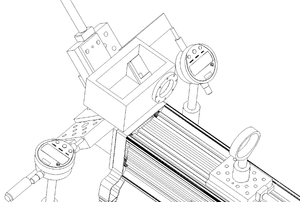
Sub-Micron Precision Using Dial Indicators
Ablation Software
- ablator.C: Core software used in creating ablation raster files.
- ablator.h: Header file for ablator.
- Map2D.cc: Package required to run ablator.
- Map2D.h: Header file for Map2D.
- ablate.py: Python module with custom methods for processing Zygo images for use in ablator.
- zygo2root.C: Software for converting hitched Zygo data files into root files.
- zfinder.cc: Package needed for zygo2root
- MetroProMap.cc: Package needed to run Zygo2root software.
- MetroProMap.h : Header file for MetroProMap.
- setenv.sh: sample of environment variables required to run above software.
