File:Energy Time.png
Jump to navigation
Jump to search

Size of this preview: 800 × 583 pixels. Other resolutions: 320 × 233 pixels | 910 × 663 pixels.
Original file (910 × 663 pixels, file size: 28 KB, MIME type: image/png)
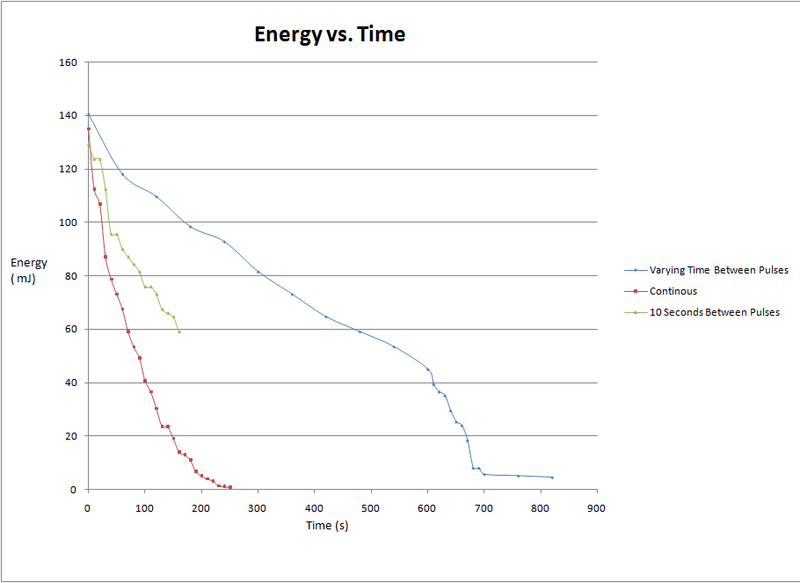
Notice that as the amount of pulses per unit of time increase (time between 0 and 26kV) the rate of energy loss increases.
File history
Click on a date/time to view the file as it appeared at that time.
| Date/Time | Thumbnail | Dimensions | User | Comment | |
|---|---|---|---|---|---|
| current | 16:07, 2 June 2010 | | 910 × 663 (28 KB) | Bpratt18 (talk | contribs) | Notice that as the amount of pulses per unit of time increase (time between 0 and 26kV) the rate of energy loss increases. |
You cannot overwrite this file.
File usage
There are no pages that use this file.