Difference between revisions of "Bad Data"
Jump to navigation
Jump to search
(Created page with "=Summary Data and Graphs= ==March 27, 2015== File:March 27 2015.png ==March 30, 2015== File:March 30 2015.png ==April 24, 2015== File:BWApril 24 2015.png ==...") |
|||
| Line 1: | Line 1: | ||
=Summary Data and Graphs= | =Summary Data and Graphs= | ||
| + | |||
| + | The graphs on this page were based on the wrong equations in LabVIEW from May to July 2015. | ||
==March 27, 2015== | ==March 27, 2015== | ||
Latest revision as of 17:51, 20 August 2015
Summary Data and Graphs
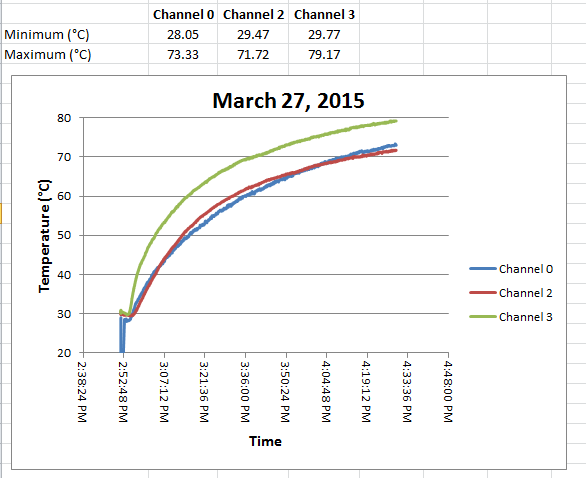
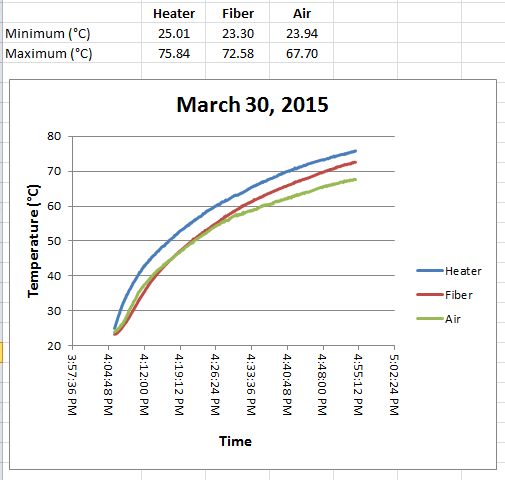
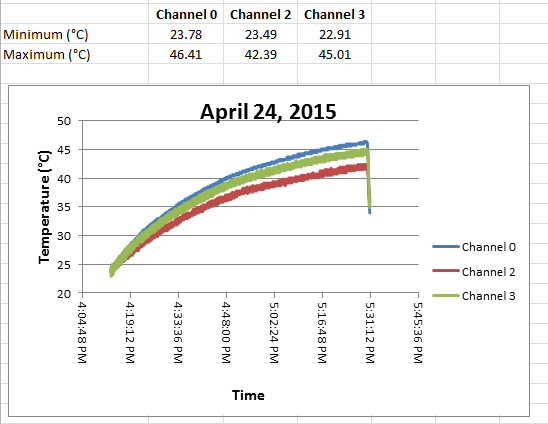
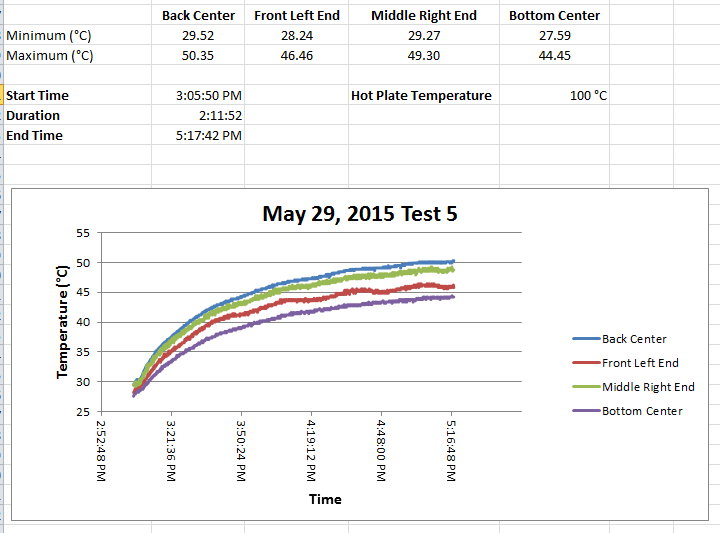
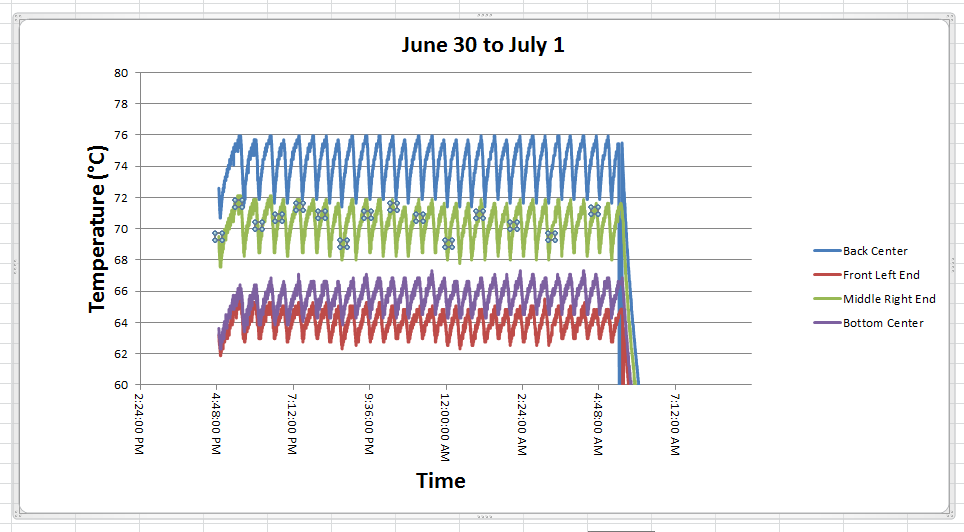
The graphs on this page were based on the wrong equations in LabVIEW from May to July 2015.
March 27, 2015
March 30, 2015
April 24, 2015
May 29, 2015 Test 5
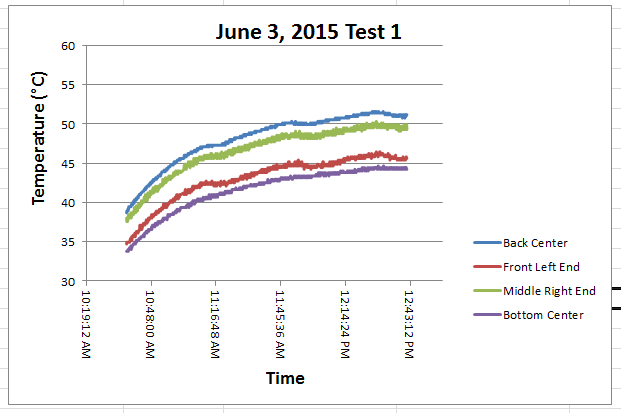
June 3, 2015 Test 1
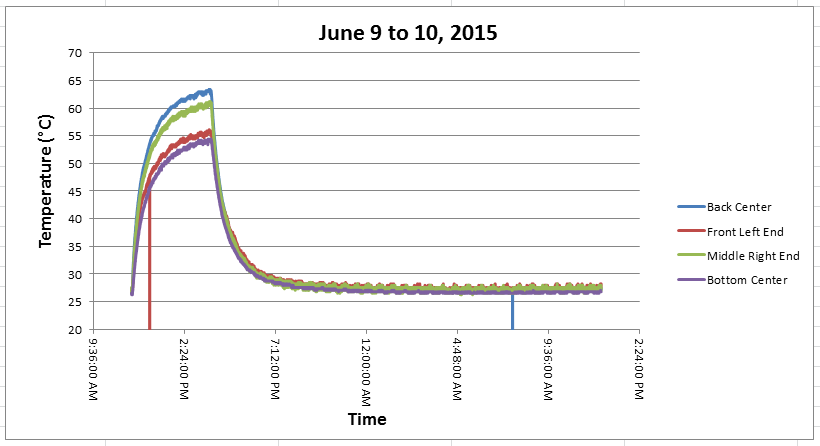
June 9-10, 2015
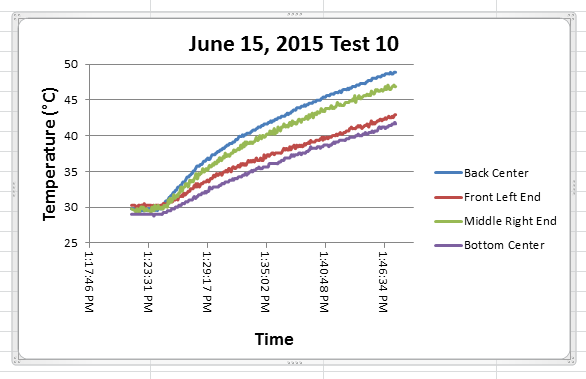
June 15, 2015 Test 10
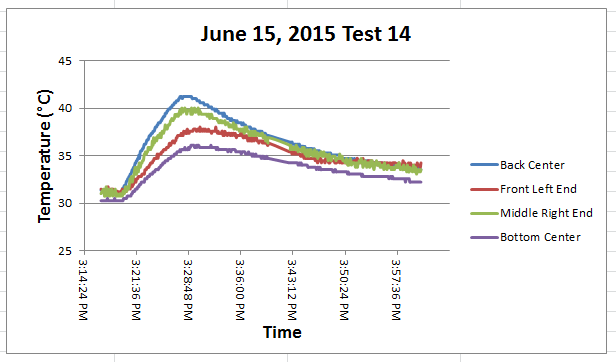
June 15, 2015 Test 14
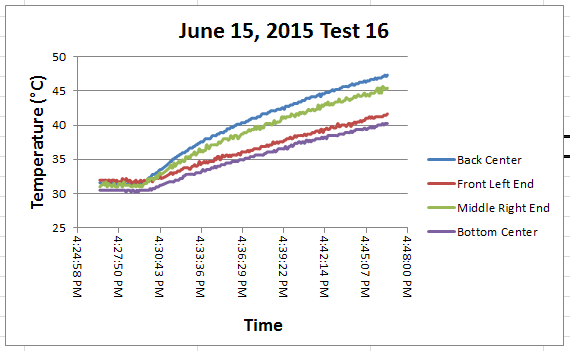
June 15, 2015 Test 16
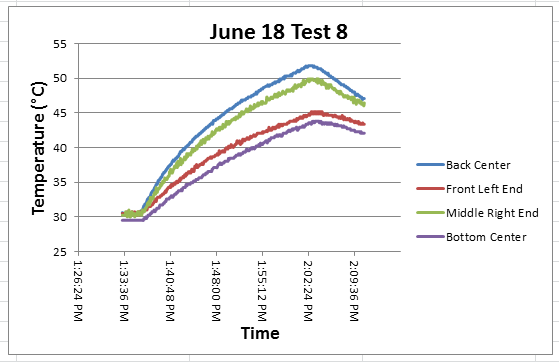
June 18, 2015 Test 8
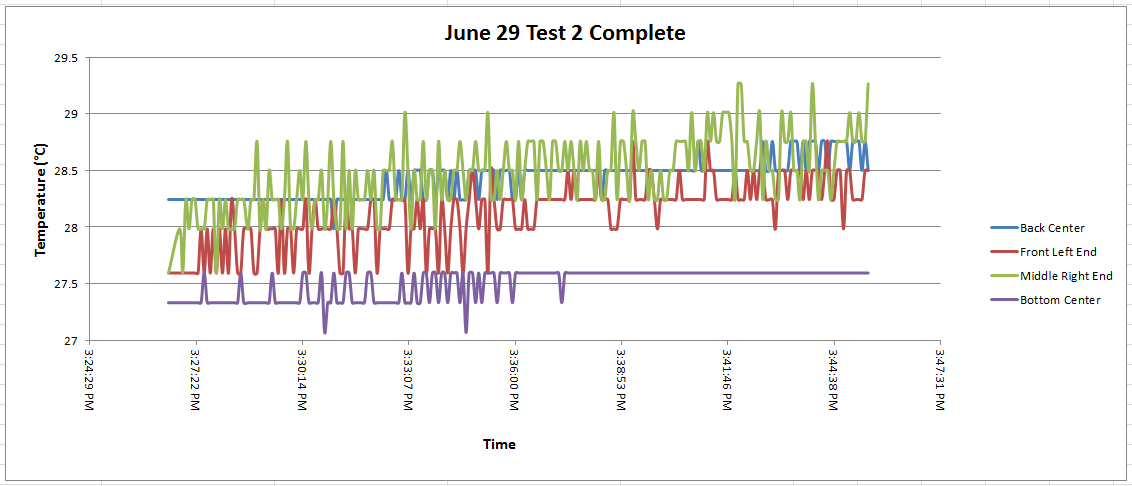
June 29, 2015 Test 2
The hot plate was off throughout this brief test to determine whether the thermistors agree at room temperature.
