Difference between revisions of "Fiber Dimension Statistics"
| Line 5: | Line 5: | ||
==Average Width of Fibers== | ==Average Width of Fibers== | ||
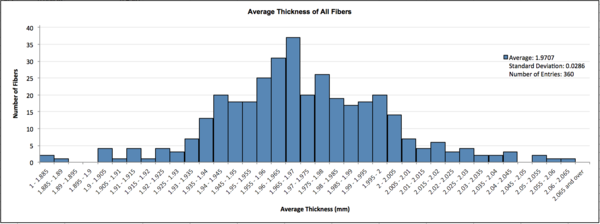
| − | An analysis on the average width of the fibers was performed to check how many were over the desired average width (2.03mm). The width of each fiber was measured at fifteen different points as a part of the cutting process. Histogram A shows the spread of average fiber width; almost all fibers meet the width specification with less than five percent exceeding the threshold width (2.03mm). | + | An analysis on the average width of the fibers was performed to check how many were over the maximum desired average width (2.03mm). The width of each fiber was measured at fifteen different points as a part of the cutting process. Histogram A shows the spread of average fiber width; almost all fibers meet the width specification with less than five percent exceeding the threshold width (2.03mm). |
[[File:Total Average.png|600px|thumb|center|Histogram A: Average width of all fibers.]] | [[File:Total Average.png|600px|thumb|center|Histogram A: Average width of all fibers.]] | ||
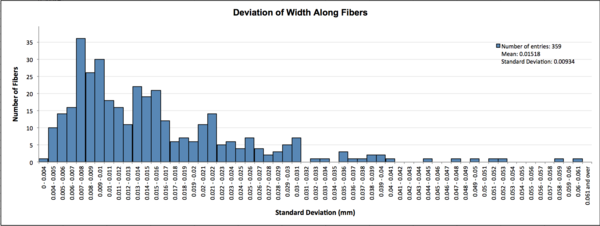
| − | In order to gauge how accurately the averages represented the fibers, the standard deviations of the widths were also plotted. On histogram B the distribution of the standard deviation of width of each fiber is shown. Over ninety percent of the fibers' widths deviate by | + | In order to gauge how accurately the averages represented the fibers, the standard deviations of the widths were also plotted. On histogram B the distribution of the standard deviation of width of each fiber is shown. Over ninety percent of the fibers' widths deviate by less than .03mm on average (1.5% of the maximum desired width). Considering histograms A and B, there are very few fibers that are too large or uneven to use. |
[[File:Dev Along Fibers.png|600px|thumb|center|Histogram B: Standard deviation of width along all fibers.]] | [[File:Dev Along Fibers.png|600px|thumb|center|Histogram B: Standard deviation of width along all fibers.]] | ||
Revision as of 01:47, 6 May 2016
This page was created by Andrew Sampino who's logbook for spring 2016 can be found here
The raw data for all of the reported statistics on this page can be found in this spreadsheet.
Average Width of Fibers
An analysis on the average width of the fibers was performed to check how many were over the maximum desired average width (2.03mm). The width of each fiber was measured at fifteen different points as a part of the cutting process. Histogram A shows the spread of average fiber width; almost all fibers meet the width specification with less than five percent exceeding the threshold width (2.03mm).
In order to gauge how accurately the averages represented the fibers, the standard deviations of the widths were also plotted. On histogram B the distribution of the standard deviation of width of each fiber is shown. Over ninety percent of the fibers' widths deviate by less than .03mm on average (1.5% of the maximum desired width). Considering histograms A and B, there are very few fibers that are too large or uneven to use.

