File:SiPM-capacitance-curve.png
Jump to navigation
Jump to search
No higher resolution available.
SiPM-capacitance-curve.png (600 × 430 pixels, file size: 14 KB, MIME type: image/png)
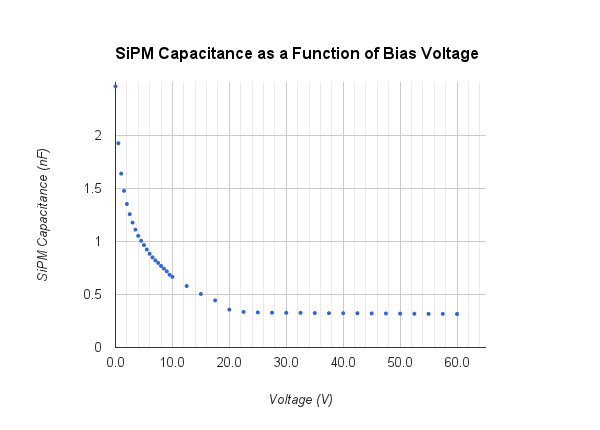
This plot shows the capacitance of a Hamamatsu 50um SiPM as a function of bias voltage from 0 to 60V.
File history
Click on a date/time to view the file as it appeared at that time.
| Date/Time | Thumbnail | Dimensions | User | Comment | |
|---|---|---|---|---|---|
| current | 19:27, 31 January 2014 | | 600 × 430 (14 KB) | Barnes (talk | contribs) | Changed y-axis range |
| 19:24, 31 January 2014 | 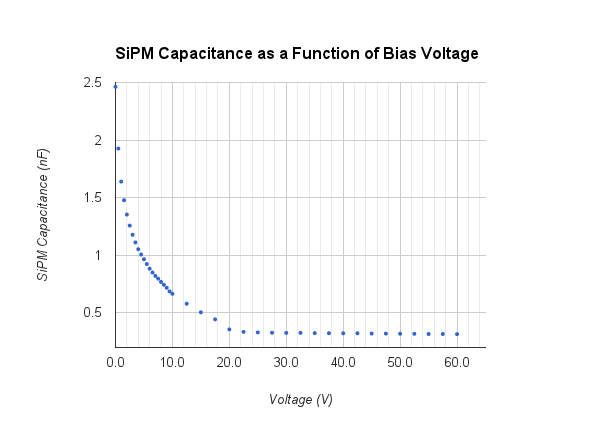 | 600 × 430 (14 KB) | Barnes (talk | contribs) | This plot shows the capacitance of a Hamamatsu 50um SiPM as a function of bias voltage from 0 to 60V. | |
| 19:23, 31 January 2014 | 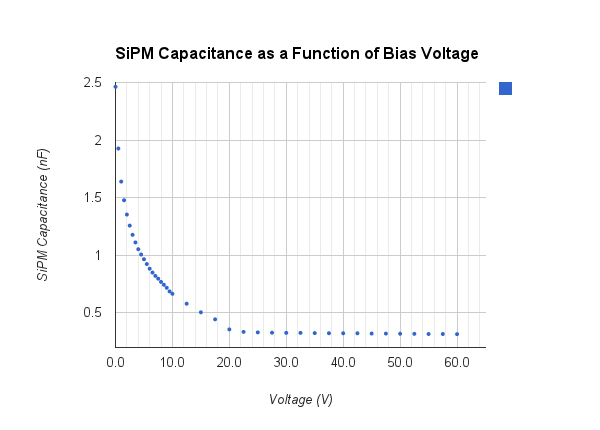 | 600 × 430 (14 KB) | Barnes (talk | contribs) | This plot shows the capacitance of a Hamamatsu 50um SiPM as a function of bias voltage from 0 to 60V. |
You cannot overwrite this file.
File usage
The following page uses this file: