Solutions
Interferograms
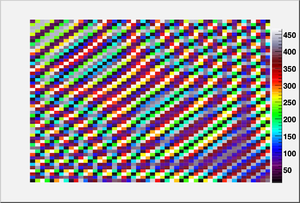 Figure 1: The test interferogram created from three random surfaces. |
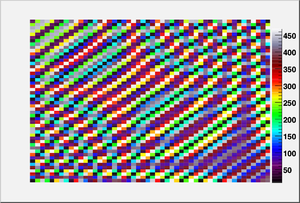 Figure 2: The best solution found amongst several simulated annealing runs. |
The set of images in Fig. 1 and Fig. 2 depict the test interferogram analyzed using ParSA and the best interferogram solution found by ParSA. When compared visually, the two interferograms are nearly indistinguishable. This comparison shows that the solution found by the ParSA algorithm is a good one.
Surfaces
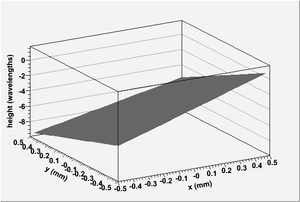
Fig. 2 and Fig. 4 show the front and back surfaces of the diamond wafer used to create the test interferogram depicted in Fig. 1. Fig. 3 and Fig. 5 show the solutions found by the ParSA algorithm which generated the interferogram shown in Fig. 2.
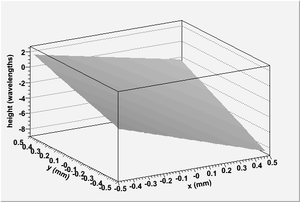 The front diamond surface used to generate the interferogram in the test problem. |
 The best solution found amongst several simulated annealing runs. |
 The back diamond surface used to generate the interferogram in the test problem. |
 The best solution found amongst several simulated annealing runs. |
Performance
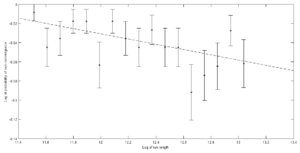 Log of probability versus non-convergence versus log of run length for alpha=0.5. |
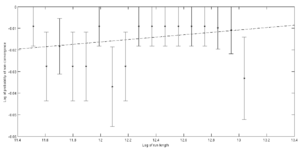 Log of probability versus non-convergence versus log of run length for alpha=0.9. |


