-
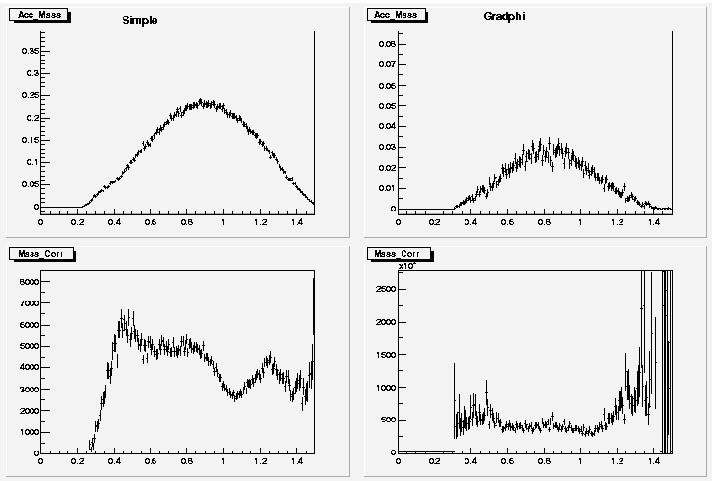
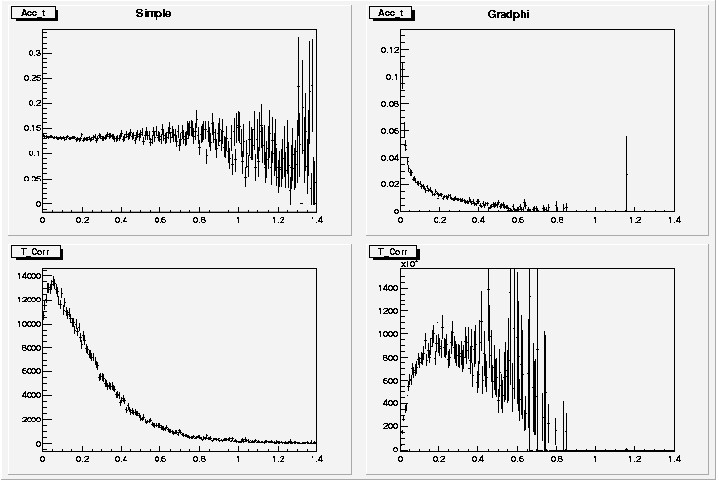
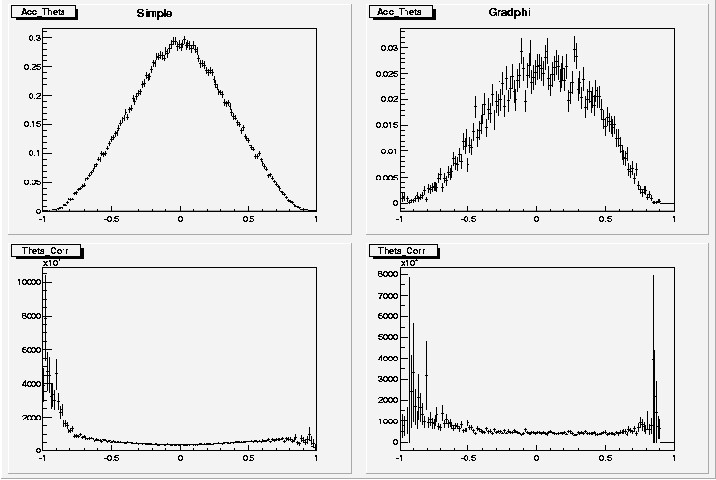
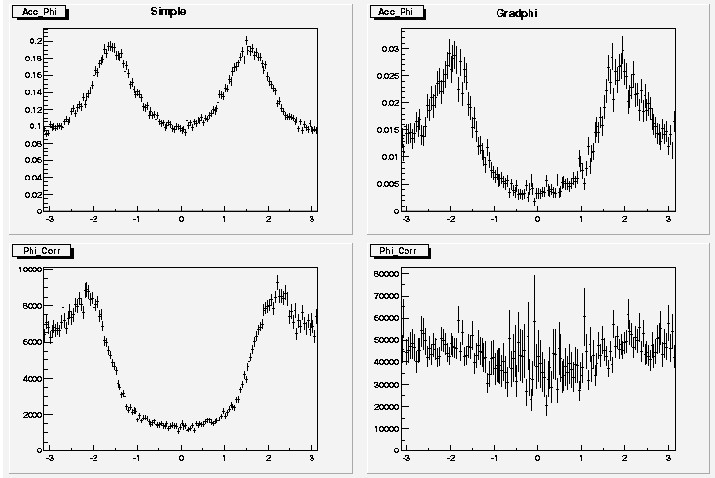
The following graphs show comparisons of acceptance and acceptance corrected distributions between a simple Monte Carlo, engineered to be flat in Gottfried-Jackson variables, and Gradphi, which shows structure in the generated cos(theta).
-
Each plot is divided into 4 sections. The top two sections show acceptances. The bottom two sections show acceptance-corrected distributions. The sections on the left correspond to the simple Monte Carlo. The sections on the right correspond to Gradphi.
Invariant Mass Distribution 
postscriptMomentum Transfer Distribution 
postscriptGJ Cos(Theta) Distribution 
postscriptGJ Phi Distribution 
postscript