Spring 2011 Beam Test of
Tagger Microscope Prototype
Table of Contents
Installation of Microscope Prototype in the Hall
New shift: 12:00 - 6:00 am 3/25 - Richard Jones
Aligning fiber axis with electron tracks
Checking the angular misalignment of fibers: correlations between channels
Accessing scalers on prototype channels
Adjusting Angle of Fibers by Inclining Prototype Frame
Working on data acquisition with CODA
Production running with the microscope
Useful phone numbers:
DHCP-given address to clonwin3 once in Hall B: 129.57.167.248
But, “clonwin3.jlab.org” does not map to this IP address currently
Old static address with which the computer came seems to have been given to another computer.
Current pointer: hallb-29.jlab.org
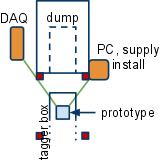
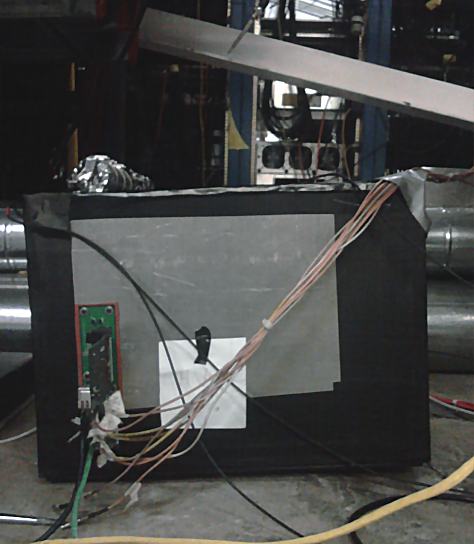
The USB cable from the alignment control system limits the distance the computer can sit from the prototype. PC was installed at the edge of the beam dump shielding as shown.
Installation casualty: a caught cable connected to the 1st sum channel pried it off the board. (It wisted already weak pins that were sanded down to cope with tight fit) We still have 1st sum’s 5 single channels and a long access may let us solder on a connector.
Important places to look for information regarding beam status in the Hall B. To select one of these links, right click and select “Go to link”.
Beam has been in the Hall since 22:00 apparently. Beam current is hovering around 9-10 uA.
A snapshot of the recent beam history from the accelerator status display is below.
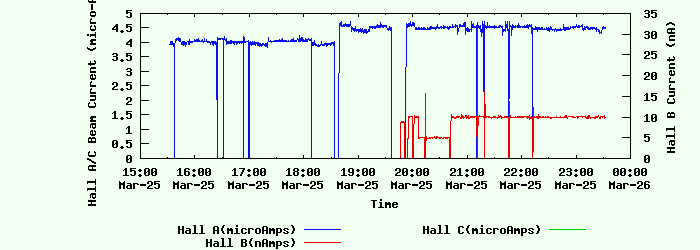
The latest logbook snapshot shows that the first radiator is in position, labeled 10-4 rad.len. It looks like the TaggerOR signal is running at about 19 MHz, which is consistent with this radiator thickness and beam current. The electron beam energy is said to be 3.361 GeV.
Leaving home now for the lab. My first shift starts in 20 minutes.
Now setting up connections for monitoring beam conditions in Lab 403. I created a continuous videoconference over the next 48 hours on evo. To connect, go to http://evo.caltech.edu and sign in, go to Gluex community, and enter the Beamtest meeting. Here I am broadcasting some useful status screens that should be continuously updating, showing the current run conditions in Hall B.
Igor: woke up 2:30am to check on things, touch base with RTJ on shift at UConn.
It appears that our Windows PC controlling the prototype (old clonwin3) is no longer accessible, pingable etc. May have died being close to the beam dump. Will try to move upstream on next access.
I set up a continuous display of the beam status on the evo screen, so we can quickly see what conditions have been like over the recent past at any time by just connecting to evo.
4:00am
Just discovered that the Windows PC controlling the microscope prototype is no longer reachable (ping from gummo is dead, no response to ssh 129.57.167.248). We need to wait for an access so we can get in and reset it, maybe move it upstream away from the dump area.
6:30am
Igor: Franz offered to go into the hall. Going in to check on the PC and move it upstream
7:20am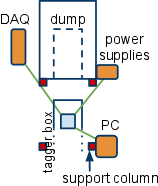
Igor: Computer restarted and moved ~2m upstream of beam dump enclosure entrance by a white support column
8:00am
Igor: Hovanes came back to the counting room and showed the GUI with rates in his counters and in our fibers. His set of 8 scintillators show a broad distribution peaking (or increasing) near the southern edge of the array, suggest that they are a few cm north of center.
Our fibers show a smaller than expected rate. The trigger scintillator showed a rate ~100kHz while summed channels saw around 2kHz each
8:45am
Igor: Walking the motors up i.e. fibers going north (‘+’ henceforth). Rates seem to drop, seemingly consistent with Hovanes’s beam-finder counter distribution:
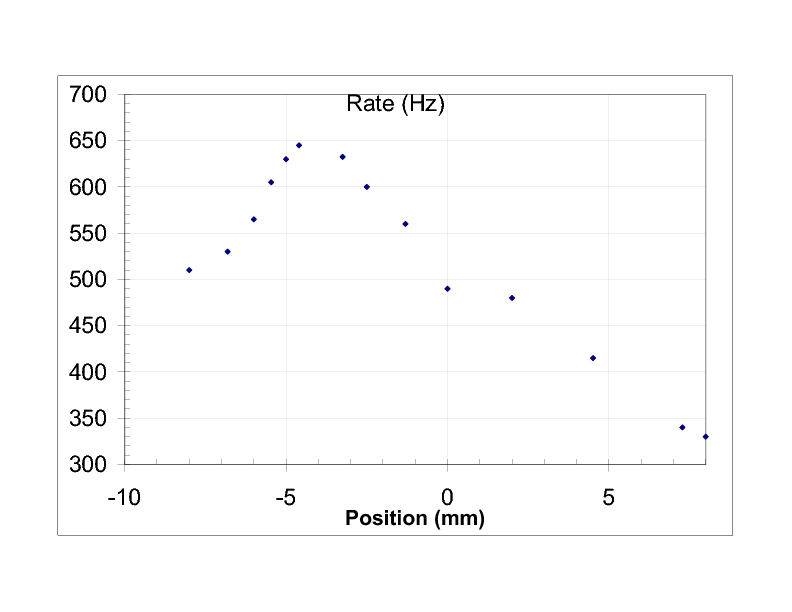
avg. in SiPM1
pos. 0: 490Hz
pos. +8mm 330Hz
pos. -2.5mm 600Hz
pos. -3.25mm 625Hz 640Hz
pos. -4.6mm 650Hz 640Hz
pos. -5mm 670Hz ??
pos. -5.45mm 605Hz
pos. -6.81mm 530Hz
pos. -8mm 500Hz 510Hz
After some more data values and checks (averaging multiple measurements at same point) we arrive at the graph shown. It is very suggestive that we are walking across the beam! In other words, we got lucky from the first try in having gotten the position within a cm. A later verification will come when Hovanes moves his counters (currently spanning one side of the beam spread, it seems) to encompass the entire x-beam spread.
Control computer down again. Exposure or some sleep setting?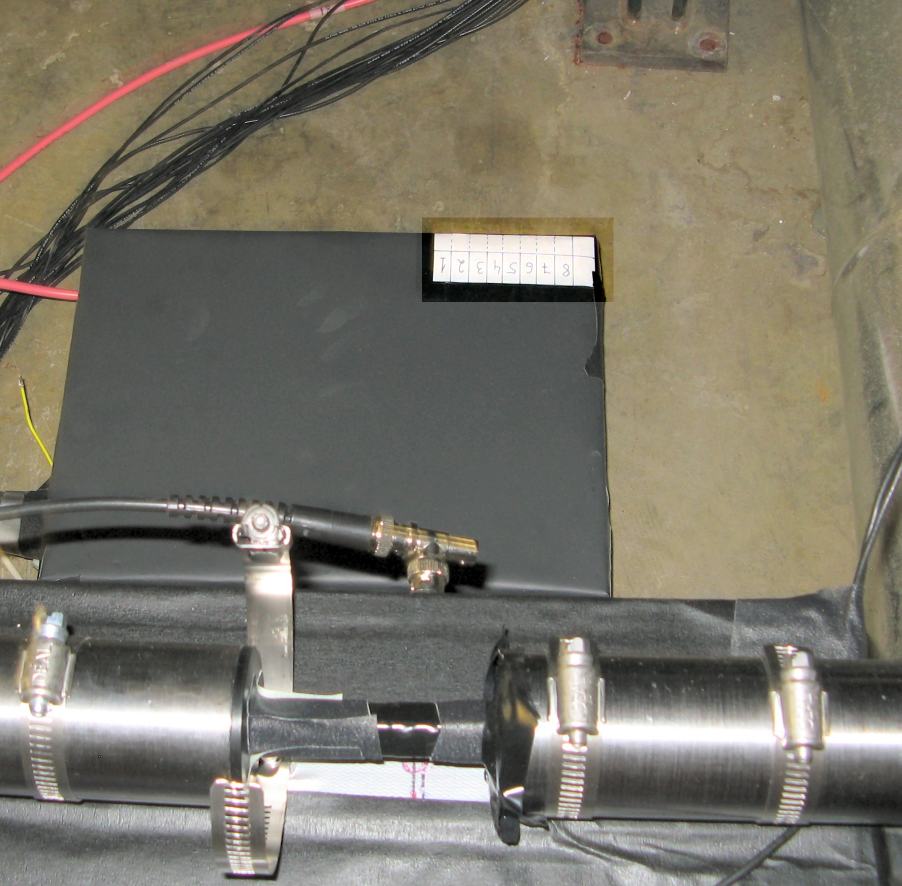
around 4pm
We got beam access: checking on the PC - it appears that the “Surveyor” power profile was in effect and the computer was in fact in suspension. Selecting the default Home/Desktop with no sleep fixed it it seems.
Took photos to check how prototype aligns with Hovanes’s beam finder (by eye, they did not seem to align, calling into question the data from rates that show us spanning the beam center). The adjacent photo, looking upstream toward the floor, shows the alignment. The edge of the pipe on the right as roughly parallel to beam and red-circled line seen under scintillator paddle (~1cm on the side) corresponds to the center of fiber bundle at motor-alignment set to zero. Now the center of the beam was found to be near -4mm (where negative is south - toward the pipe) and Hovanes’s beam finder shows the center near scintillator 3 (they are ordered left to right in this photo). So the alignment we get from the rates is plausible according to this picture.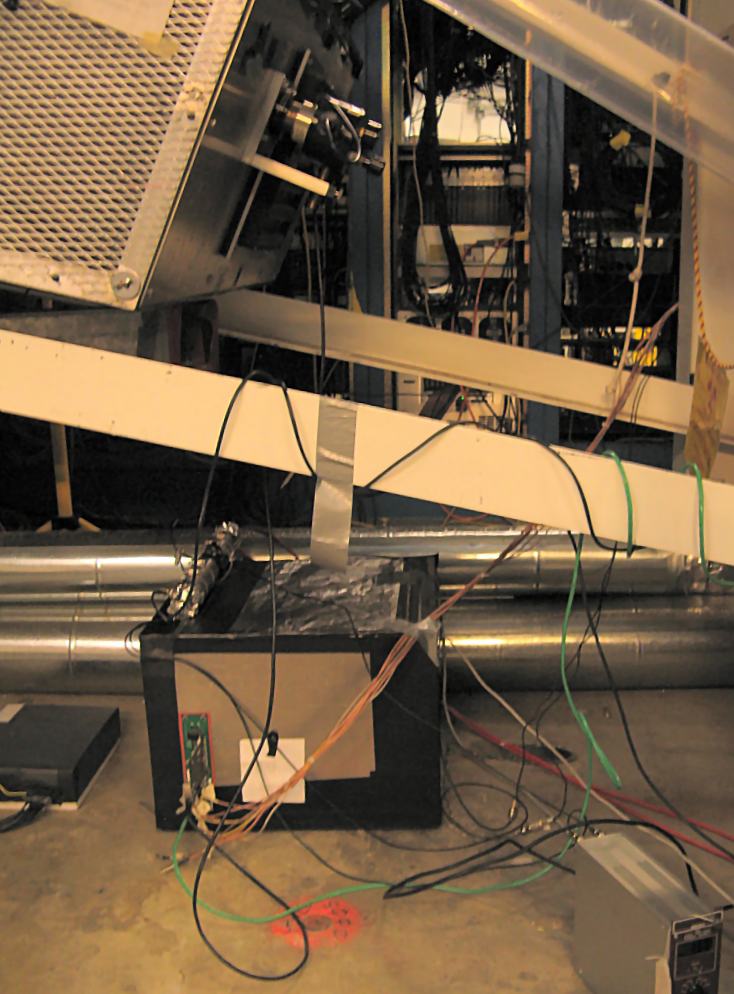
Current set up is also shown. The SciFi seem to be right below the bottom corner of the tagger counter box.
6:30pm
Sascha came back for a short session this evening. Current assessment from discussions:
Prototype control computer is down again! Does the “Home/Desktop” no-suspension power profile get over-ridden?
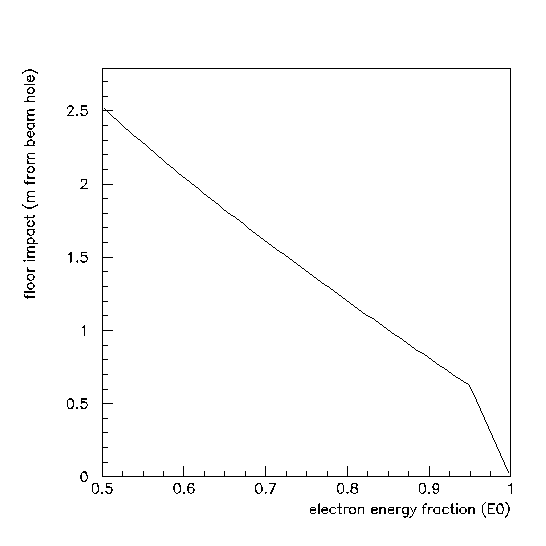
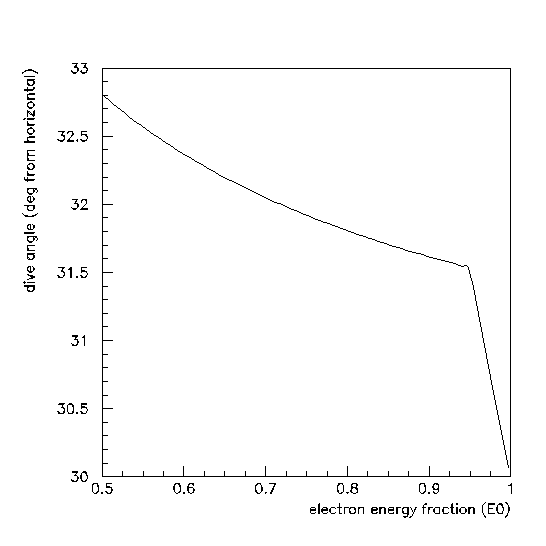
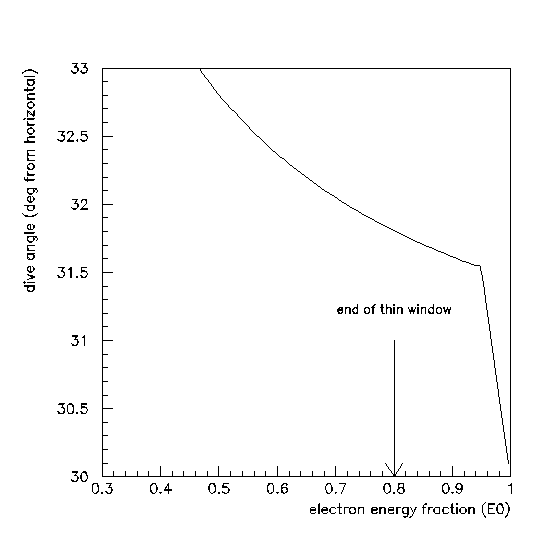
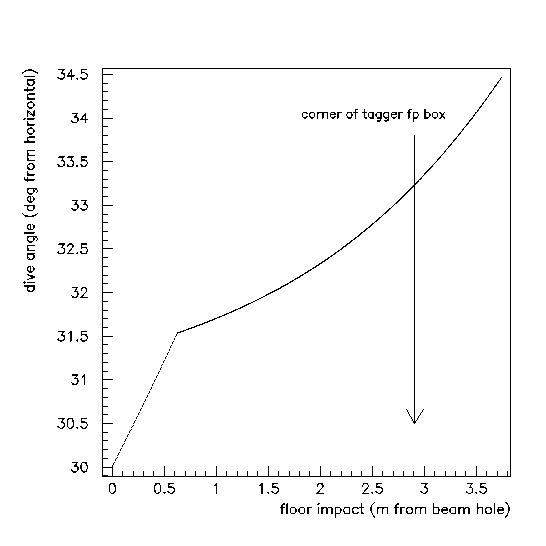
Richard Jones -- In order to optimize the light output and inter-channel separation between the different energy channels in the microscope, we want the fiber axis to be as collinear as possible with the direction of the electron trajectories passing through them. I have calculated the dive angle of the electrons at the floor level as a function of energy (actually the fraction of the endpoint energy, which works for any electron beam energy), and also the impact position on the floor, measured along the floor relative to where the primary beam crosses the plane of the floor. The graphs below show these two variables plotted individually as a function of post-bremsstrahlung electron energy, and also one versus the other.
Igor: Estimating the angle of electrons at the current prototype position based on the following:
Based on our position of about 295cm from beam hole implies 42% of full energy which corresponds to 33.3deg.
Installed angle of the SciFi bundle: 35.1deg
Can a 1.8deg misalignment explain our low rates in SiPMs?
4pm
Working with Sascha on data acquisition.
Current issues:
Current data repository (from a clon PC): /misc/home/somov/data
File naming convention: [configuration]_[run number].evt.0
Currently configuration=ROC_TEST
Analyzer: /group/halld/Subsystems/trigTest/analysis/fileAnalyzer.cc
Environment: /group/halld/Subsystems/trigTest/setEnvVars
(necessary for making the analyzer)
RF threshold = 80mV
Run 105:
Run 113:
Run 114: 412745 events
Run 115: 412931 events
Visually unstable RF during installation, setting new threshold:
RF threshold = 120mV
Current trigger counter rate from scaler: 350kHz
Run 117: 525565 events
Run 118: 160575 events
Run 119: 217296 events
Run 120: ~200k
Run 121: 817932 events - no crash! (we quit while we are ahead)
Run 122: 394844 events
Data from above runs has been copied to /scratch/BeamTest-3-2011/Microscope/
I [Igor] have only had success so far compiling the analyzer in JLab on i386 (e.g. jlabl3) with $ROOTSYS pointing to version 5.18
Sacha has provided a basic analyzer for the evio files generated by Coda.
fADC channel mapping:
# | physical signal | Comments |
0 | group 1: single chan. 1 | |
1 | group 1: single chan. 2 | |
2 | group 1: single chan. 3 | |
3 | group 1: single chan. 4 | |
4 | group 1: single chan. 5 | |
12 | sum 2 | |
13 | sum 3 | |
14 | sum 4 | |
15 | a discriminator of some sort? |
F1TDC channel map:
Chip | Channel | physical signal | Comments |
4 | 0/1* | sum1 | |
4 | 2/3 | sum2 | |
4 | 4/5 | sum3 | |
4 | 6/7 | sum4 | |
5 | 0/1 | group 1: single channel 1 | |
5 | 2/3 | group 1: single channel 2 | |
5 | 4/5 | group 1: single channel 3 | |
5 | 6/7 | group 1: single channel 4 | |
6 | 0/1 | group 1: single channel 5 | |
6 | 2/3 | trigger scintillator | |
6 | 4/5 | accel. RF???? | see plot below titled “dt_RF2” |
*The reason for quoting neighboring channels is a current bug in TDC output: in 60ps resolution mode, instead of using channels 0, 2, 4... to serve half the channels as promised in this regime, it oscillates between even and odd channels. One must check if the current event’s TDC output is on even or odd channels.
Note: unless properly labeled, TDC histogram units are in 60ps bins.
3/28/2011 - Richard
Igor points out that the current position of the microscope under the tagger is actually outside the range of the plots that I posted above, showing electron angle and displacement along the floor under the tagger, as a function of electron energy fraction. Here I redo them, with an expanded range.
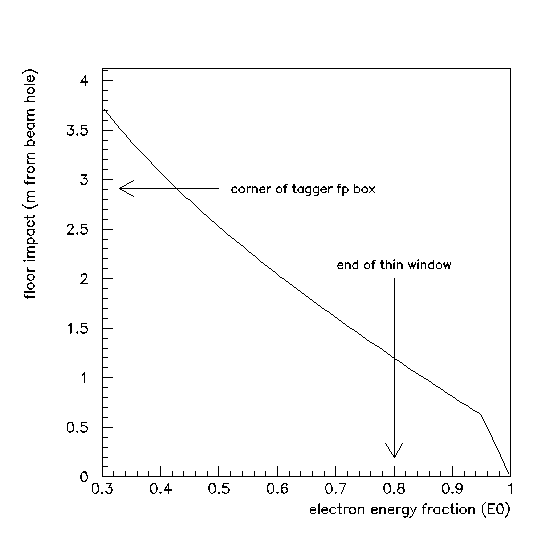
One comment I should add about this coordinate system is that the fibers are not sitting on the level of the floor, so locating the entry end of the fibers a distance x from where the beam enters the floor, and interpreting x as the coordinate shown in the above plots will not be correct. If the fibers are a distance H (average) above the floor, then the floor impact of rays passing through the scintillators will be at
x(floor)=x(fibers)+H*cot(θ)
Igor estimates H to be 32 ± 1cm. Using θ=32° leads to an offset of 51 ± 2 cm. So placing the prototype with the fibers right under the corner of the tagger fp box corresponds to a floor impact distance of 240 cm, and an incidence angle around 32.6° and tagged energy of 0.50*E0. Jim believes that the nominal fiber inclination angle of 31.5°, but Igor recalls this number as 35.1° (juxtaposition of digits?). We need to somehow determine which of these is correct. Maybe we can tell just by looking at the data. This is what I want to do next.
9:50am: Run conditions at present are as follows.
This expected rate at the fibers predicts that the trigger scintillator should be seeing a rate of about 240 kHz, and each column sum in the fiber array should be seeing about 48 kHz.
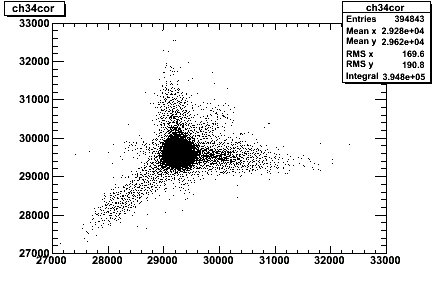
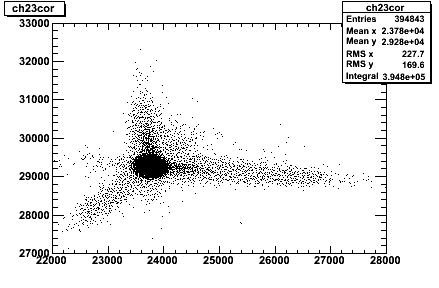
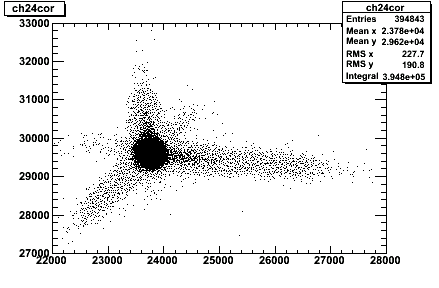
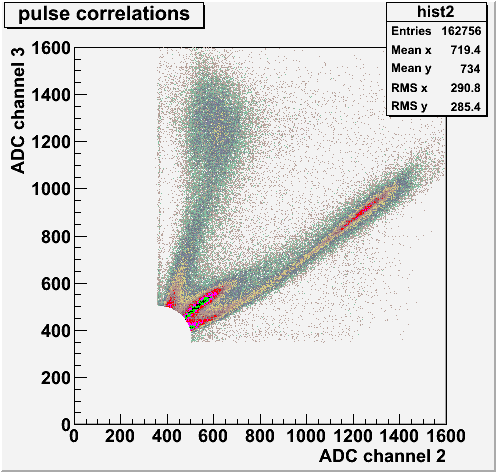
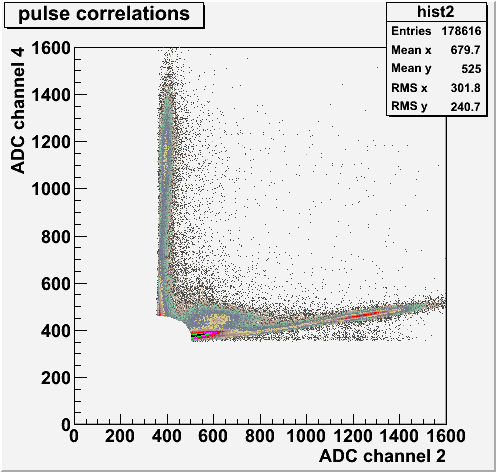
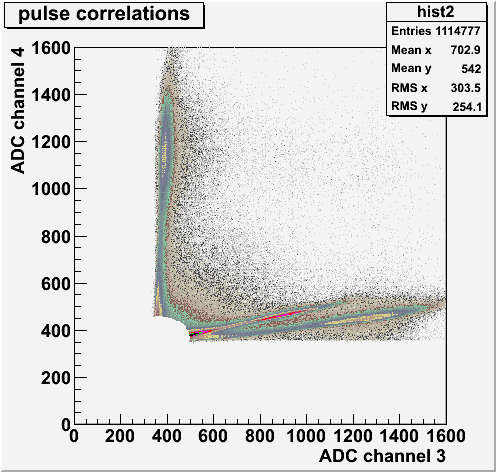
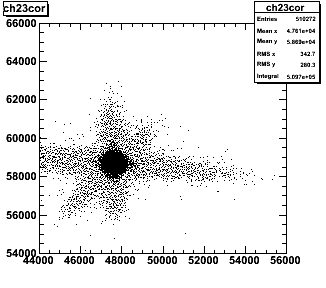
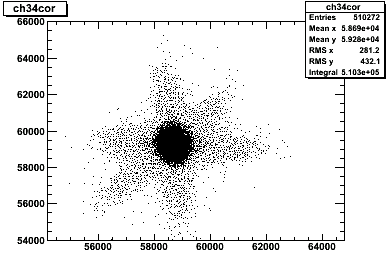
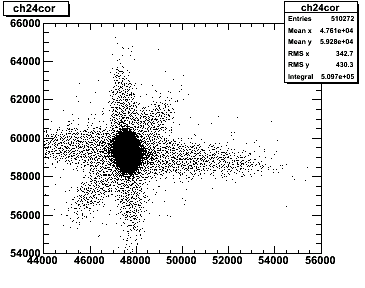
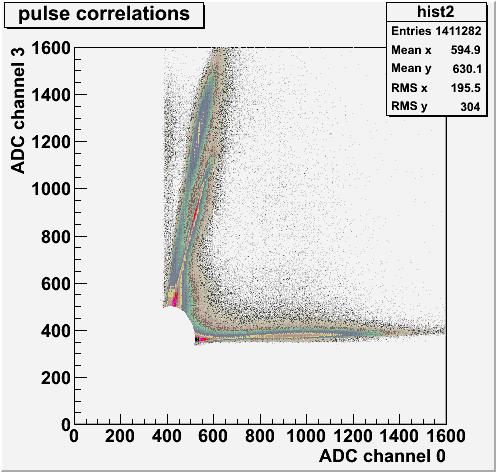
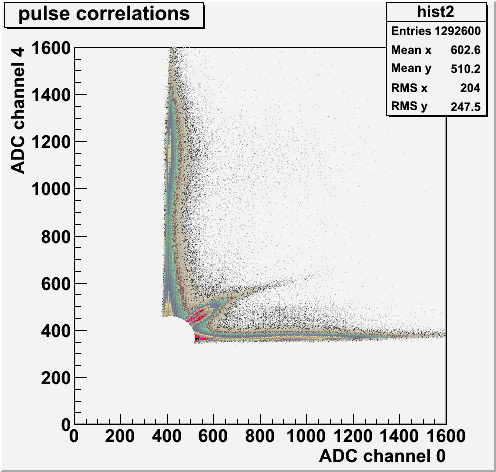
As a check whether an electron passed through 2 fibers, I plot here correlations between the
“integrals” of signal from adjacent summed
channels (different energy bins) from run 122. The axes are the sums in ADC units across an entire trace.
Title notation: ch[n][m]cor stands for “sum on channel ‘m’ versus sum on channel ‘n’”
The diagonal band stretching to the upper-right from the populated central region (arising from pedestal) suggests significant cross-talk.
Here are the steps for viewing the EPICS GUI Hovanes made for looking at rates on our instruments:
Ensure that you forward an X session or have X forwarding in your ssh session.
Verifying the default angle of the scintillating fibers:
Adjacent is a drawing of the rail system that aligns the fiber bundle with c=3”. I measured the distance between the outter sides of the rails (perpendicular) 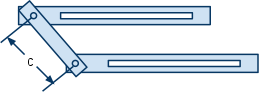
to be 2.1” giving angle=asin((2.1”-3/8”)/3”)=35.
Drawing which shows distance “c” to be 3.0 inches.
Jim - 3/28
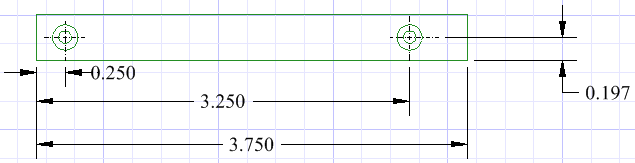
The distance between the center-line of the ¼-20 bolt holes in the back of the prototype frame is 16.5 inches. Therefore, in order to adjust the angle of the fiber bundle by 1 degree, one must turn the ¼-20 bolts on either end of the frame by approximately 5 ¾ turns.
{ Turns per Degree } = { Height = 16.5 * Tan (1o) } * { 20 Turns per Inch } = 5.76
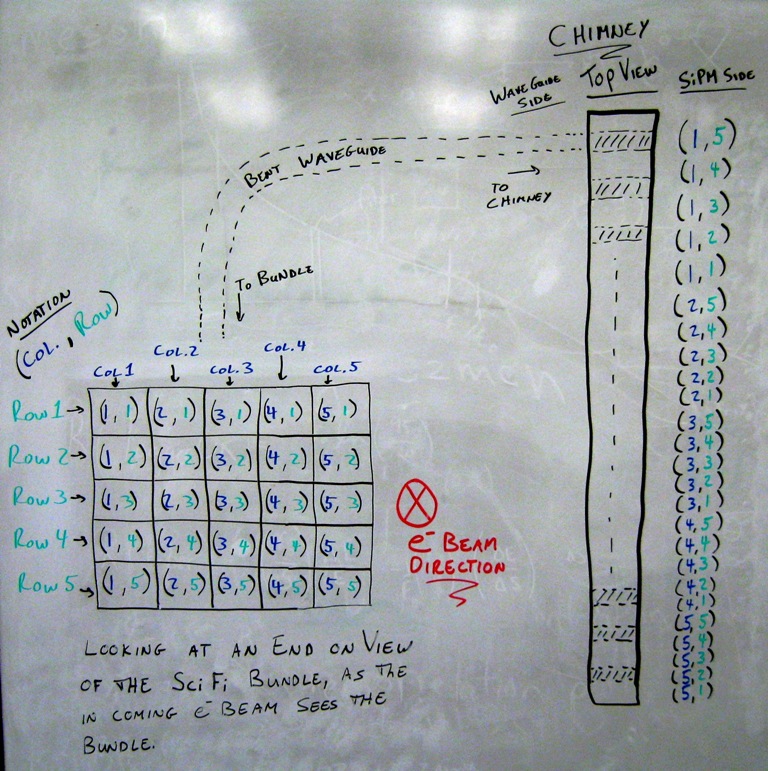
Fridah Mokaya, 14:20
Below is the image left on the whiteboard in P-403b, showing a map of the fiber connections to SiPM channels on the preamplifier board. Decided that this should be a part of our record.
Note that the beam scan performed earlier was done with the “1st” single channel, i.e. Row 5, Col 1 fiber. The corresponding variation of the rate in Row 1, Col 1 confirms the arrangement shown.
The photo here shows the 2deg tilt clockwise.
Running now at >50nA beam current
Run 125: 115895 events
Run 126: 333999 events
The readout from the TDC doesn’t seem to go in chronological order of hits. I am beginning to doubt the readout channel order.
From now on the trigger rate dips down to ~10kHz from >100kHz
change: 40mV on trigger
Run 127: 521834 events
change: 60mV threshold on all sums
Run 129: 387529 events
change: 60mV threshold on all SiPMs
Run 131: 160967 events
Run 133: 48553 events
Run 134: 510272 events
It seems evident now that the trigger PMTs are saturating. Their rate goes up on a beam trip, as if they have time to recover to normal operation. After return of full beam they do not sustain high rate for long (not enough occurrences to say anything quantitative)
9pm
Had access to the Hall. Turns out the PMTs were at 1.3kV! Turned down 1.2kV. Looking first at rate of cosmics went down by a factor of ~5.
Some more plots with correlations between sum signals: Run 134
Several machine addresses that might be useful, if Wake-on-LAN is set up to work:
Once again, overnight the clonwin3 machine went to sleep and left me stranded. But this time, I was armed with the MAC address of this machine (see above). I downloaded and installed the Fusion Wake-on-LAN client, and entered the MAC address of clonwin3. Shortly afterwards I was able to log in on this machine, so I am fairly confident that Wake on LAN is working.
E-mail from Hovanes in the early morning:
We may need to take out the PMT closest to the pipe from the trigger for the prototype if we run at beam current above 40nA. That is the one crapping out at high rates, I put the individual signals into the scaler.
I changed the HVs for trigger counter into the Lecroy card to control it remotely, but it seems like that the mainframe the card is in is bad and it goes out of control in 15 mins after a reboot. So it was not very helpful.
Current HV settings:
Status at 07:00 on 3/29/2011 - Richard
We have only an hour or so left of beam this morning before the accelerator group takes it away for beam studies. This gives Alex a chance to go into the hall and get things working again with the trigger counter. Hopefully we will get beam back again mid-afternoon and we can take up again where we left off trying to determine what the efficiency of the scintillating fibers is. For me, it is time to go home and get some rest.
9:00am
Trigger count rate as of this morning (after HV settings by Hovanes mentioned above): 100kHz
Hovanes reports that by itself, the “healthy” PMT counts >300kHz and the “sick” one with its new log gain counts ~100kHz leading to the coincidence rate set by the latter due to AND logic.
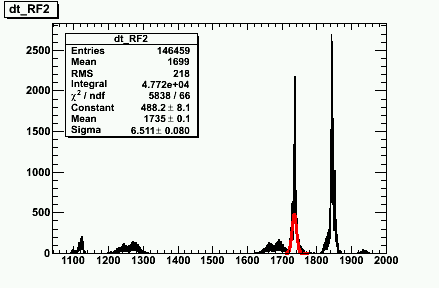
A check on the time resolution of TDC by marking the accel. RF. The plot shows the distribution of time differences between adjacent RF peaks (N.B. not 2ns - there is prescaling) Theoretically this is a sum of two random variables with same distribution so the TDC resolution is the sigma from fit below/sqrt(2). From this we get a resolution >50ps!
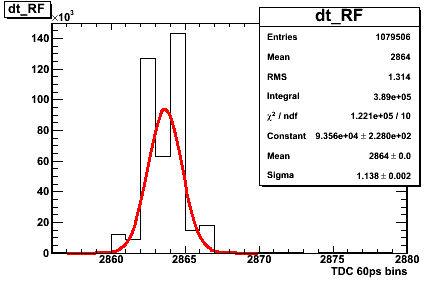
Update: more precisely, the TDC bins are 56ps leading to 1.136*56ps/sqrt(2)=45ps!
Review of thresholds: 60mV all SiPMs, 40mV for trigger, 120mV for RF
Run 135: 1035993 events
Run 136: 924794 events
Run 137: 64940 events
Run 138: 1190188 events
Return to original angle (nominally 35.1deg) from Run 143
March 30, 4:00am - Richard
Working on learning how to start and stop runs, and take data with the CODA system that Sascha set up on clonpc3. I logged in to clonpc3 as clasrun and started a vncserver. This is running on screen 9 currently. I then created a listener on zeus.phys.uconn.edu on port 5909 that is forwarded to localhost:5909 on clonpc3, and connected a vncviewer to localhost:5909 on zeus from my laptop.
On clonpc3:
The following programs must be started with commands as shown. To see all messages, run each in its own xterm window. Remember to source coda_user_setup for each session. It is assumed that you are in the home directory for the coda DAQ installation (e.g. “uconn” directory under the clasrun home directory)
Once in the GUI
To watch activity on ROC:
If ROC hangs, type reboot or Ctrl-X
Data destination is specified in the CODA_DATA environment variable (set initially in coda_user_setup)
Shared VNC session for running Coda:
zeus:5909
password same as “clasrun” user.
Recommended access procedure: log in to zeus with forwarding set up as:
Connection on user’s comp: vncviewer localhost:59xy
Run conditions are now as follows:
Data files are now being written directly to the scratch disk at /u/scratch/jonesrt/. Inside this directory are two subdirs used to manage the copy job that pushes the data files to the disk cache at UConn. The names are /u/scratch/jonesrt/tocopy (move files in here to push them to UConn) and /u/scratch/jonesrt/copied (this is where the copy job puts them after the copy is complete). Just to be safe, the files are not automatically deleted after the copy, but saved in the “copied” folder instead. Someone needs to come along at some point and delete the copied files out of the “copied” folder, once they have made sure that the copies are safely archived.
A. Barnes is now on shift, as of 18:00, 3/30/2011
~ 5.0M events
~5.0M events
~5.0M events
~5.0M events
J. McIntyre is now on shift, as of 00:00, 3/31/2011
B. Pratt on shift 05:45, 3/31/2011
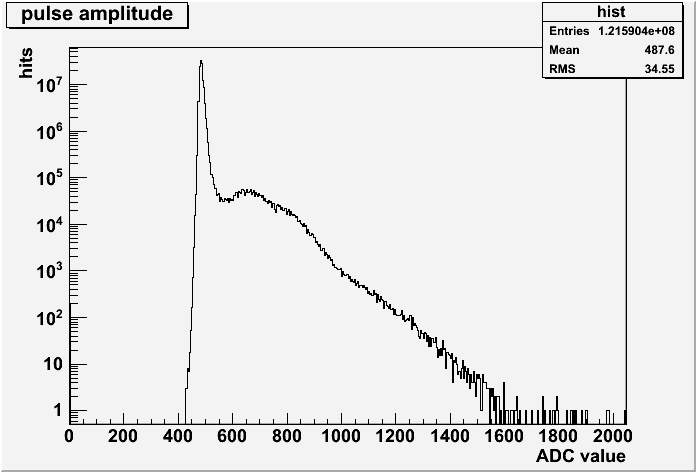
Browsing the data, I see that channel 2 (the middle fiber in the individual readout column) gave up around the start of run 180, and started just returning a fixed value around 640. This is a bummer because that is the middle fiber, and seemed to have the best looking spectrum while it was working. But that is what happened.
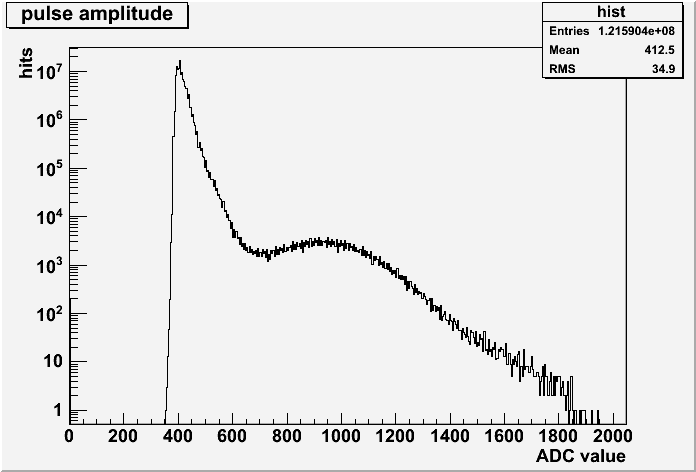
channel 0: individual fiber #1 channel 1: individual fiber #2
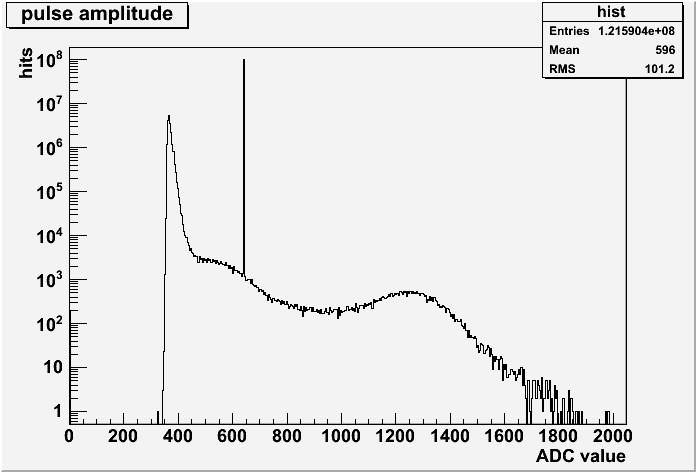
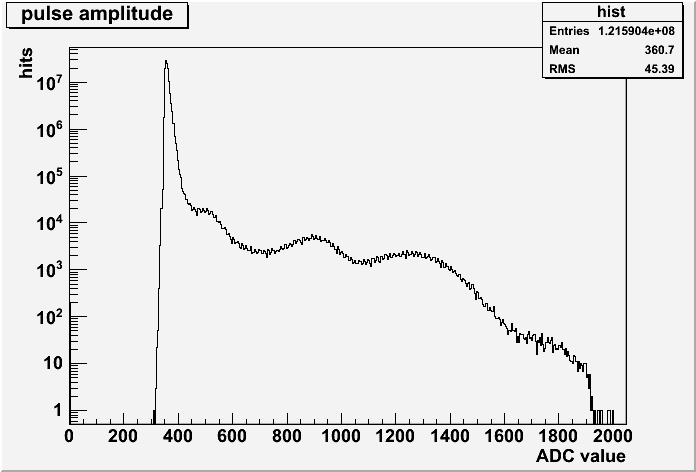
channel 2: individual fiber #3 channel 3: individual fiber #4
I am not sure what all of these multi-peak structures are. I think I understand fiber #1 better than the others, but it is probably not seeing the maximum intensity of the electron flux. It is better to start by looking at the center one, fiber #3. Here I see two peaks: a low one around 200 and a larger one around 900 channels above pedestal. Fiber #5 has a similar appearance. Fiber #4 is more complex.
These spectra are summed over the entire run. I checked if these different peaks were just coming from different run periods, and as near a I can tell the shapes are uniform across the entire run period, except for the monotonic peak that appears in fiber #3 after 20M events. This channel ADC quit working at that point, apparently.
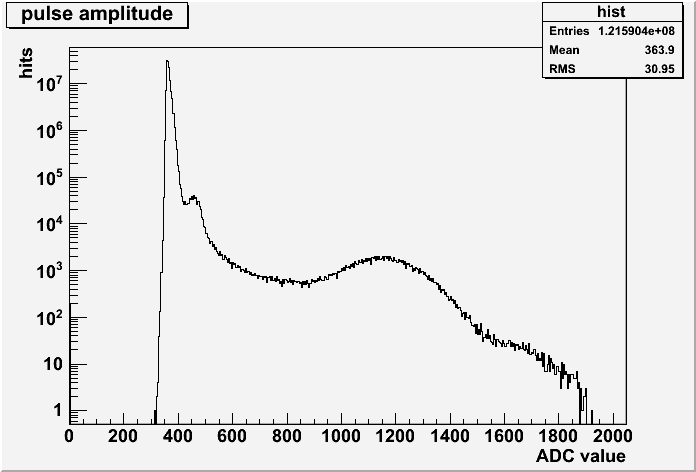
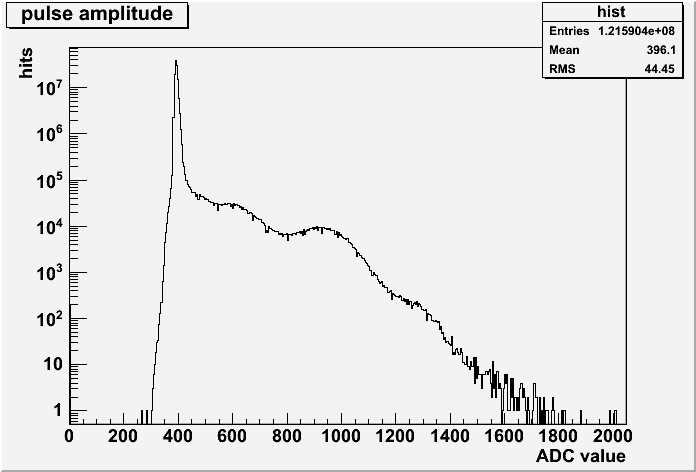
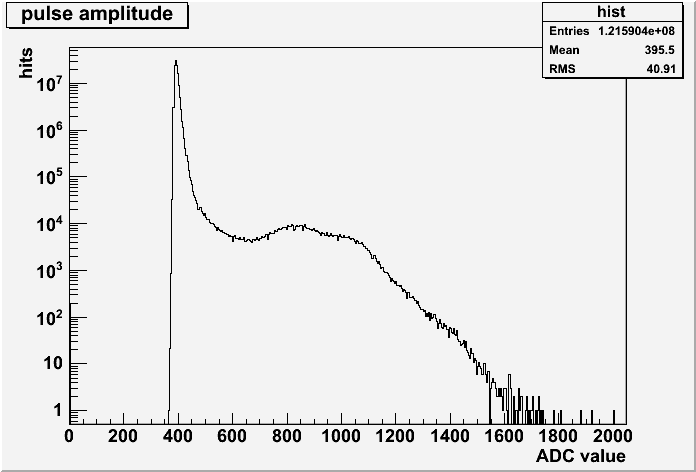
channel 4: individual fiber #5 channel 12: column sum #2
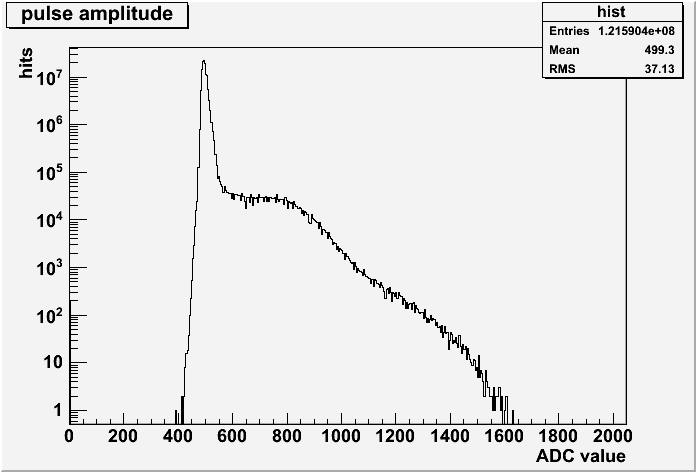
channel 13: column sum #3 channel 14: column sum #4
Comparing the summed channels with the individuals, it looks like the gains might be a factor 20% smaller, but not the factor 2 that is expected, based on the claim that the ADC ranges were different by a factor 2. The only one that seems to stand out with a significantly higher gain is individual fiber #1 (channel 0). It is plausible that this one had a smaller full-scale ADC setting than the rest, perhaps 500 mV instead of 1V. It is hard to tell with that channel because it is too far out of the beam to see much of the primary electron flux. But the pedestal width contrast seems to suggest this.
Next I look at all of the i x j scatter plots to look for correlations between these spectra. To get rid of the pedestal peaks, I eliminate events for within a 3-sigma ellipse around the pedestal peak in the scatter plots. One can see a whole lot more in the scatter plots than in the projections. What show up as overlapping peaks in the projections are separated structures in the scatter plots. I show all combinations of the individual channels in the following 10 scatter plots. The z axis is plotted in color-log scale.
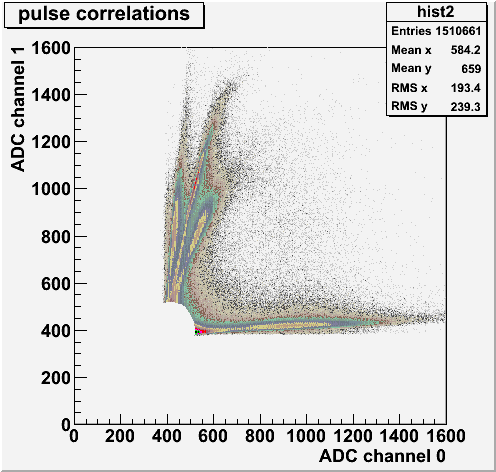
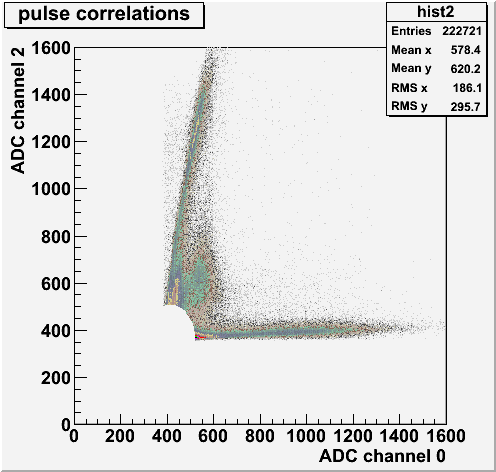
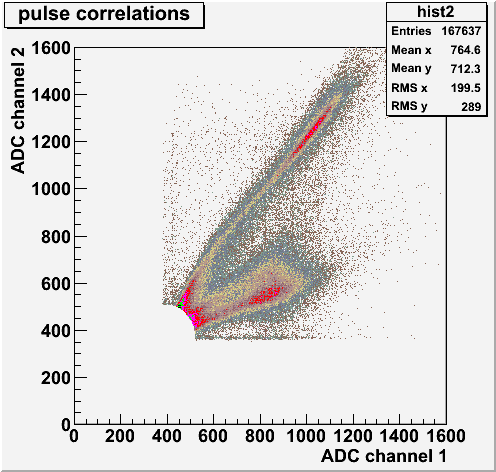
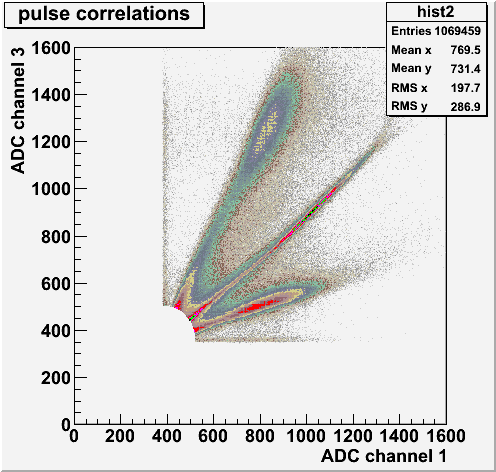
Looking at these correlation plots, I propose the following working hypothesis for their interpretation:
By “band”, I am excluding the low-intensity shadow of the opposing pedestal that lies along the extreme edge of the plot. I am assuming that there is some non-neglible cross talk between all of the channel pairs, so all of the bands I am referring to have some non-zero angle with respect to the axes. According to this rule, all of the interior structures (those that lie in between the bands referred to above) must be coming from events originating in neither of the two channels being plotted. These come from cross-talk.